Smart Signal System Report - February 2025
This email has a short mid-month market update at the end but primarily is the text based version of last week’s YouTube video.
System Report for February, 2025
For February 2025, the Smart Signal System delivered:
15-year return: 10.4% compound annual growth rate (CAGR)
5-year return: 12.8% CAGR
12-month return: 7.6%
one month return -.25%
You might recall that last month's 12-month return was around 17%. The significant change occurs because of the natural variation in both the starting and ending months. You may see this kind of change each month.
Market Update and Big Picture
Looking at our 20-year logarithmic chart, you'll notice a fractional double top formation in the upper right:
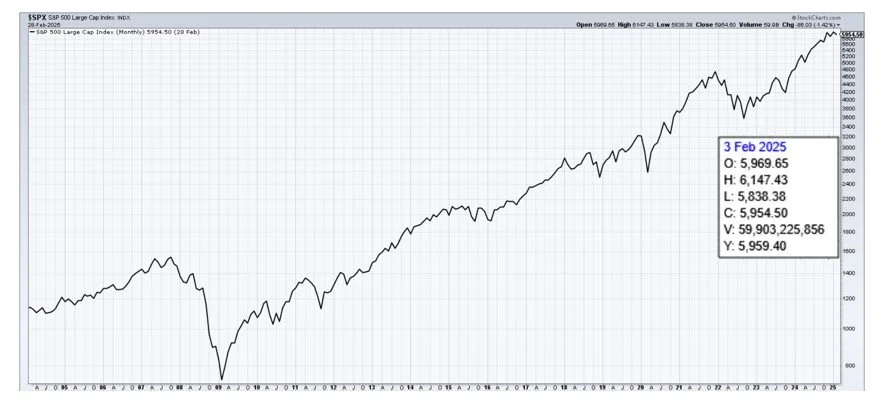
The S&P 500 closed February at 5954, after reaching a new all-time high of 6147 on February 19th. The market declined during the last two weeks of February and into March.
Interestingly, while the S&P 500 relative return was flattening since late last year, the SmartSignal System detected strength in foreign stocks. This one-year relative performance chart illustrates the difference:

The S&P 500 rose steadily until the end of last year and then plateaued while foreign equities had remained flat. At the start of 2025, foreign equities began a strong upward trend. Our system recognized this shift in relative strength and adjusted accordingly. We now hold positions in both the S&P 500 and the better performing foreign equities.
Looking more closely at foreign markets, we're seeing impressive gains between 11-21% for China and major European economies since early this year:
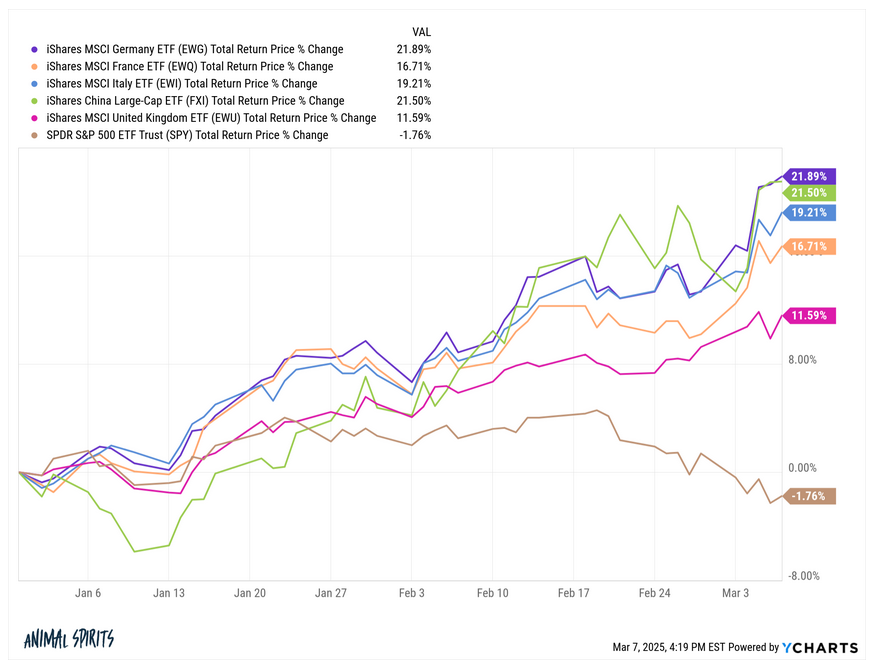
While there are several theories about why foreign equities are performing well, the beauty of our system is that we don't need to speculate. The system does the work for us, identifying the trend and positioning us to benefit from it.
The Reality of Market Drawdowns
If I had to summarize our current market situation in a headline, it would be: "Drawdowns Happen."
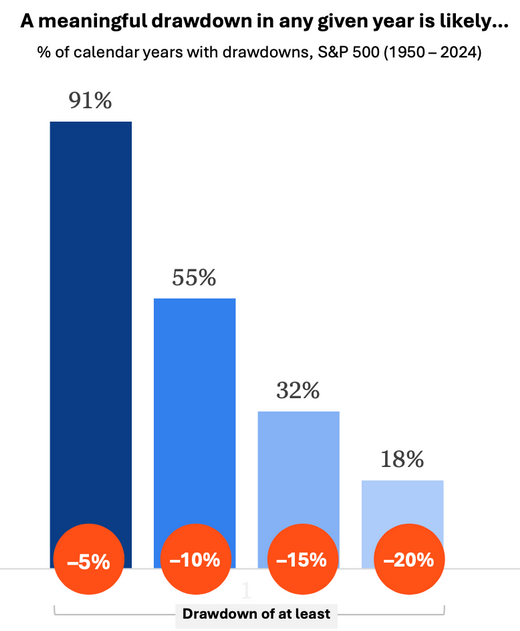
Here's what investors can expect in any given year:
A drawdown larger than 5% approximately every other year
A decline exceeding 10% about every other year
A 15% or greater drawdown on average every third year
A 20%+ drawdown approximately every six years
As of March 10th, the market is down 8.67% from its peak—approaching but not yet reaching the 10% correction threshold. Could it get worse? Certainly. Looking at recent market history, we've experienced both small and large drawdowns:
Annual Drawdown Percentage Amount

The good news for Smart Signal System subscribers is that our approach typically:
Results in shallower drawdowns (usually about half the market's decline)
Experiences shorter recovery periods than the broader market
When the market drops 20-30%, our system typically declines only 10-15%. The exception was 2022, when the system was down 16% while the market fell in the mid-twenties—that’s still better, though not quite half as severe.
Taking a historical perspective back to the 1940s, we can see that some market drawdowns have lasted years:
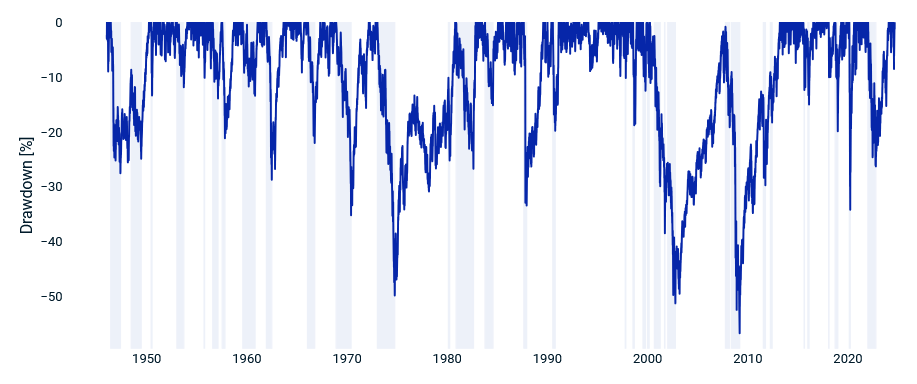
The 1970s into early 1980s, the aftermath of the dot-com bust, and the period following the Global Financial Crisis all saw prolonged drawdowns lasting several years. These were typically severe, often exceeding 50%. The COVID crash in 2020 was unusual—an extremely rapid and deep drop but remarkably brief with markets recovering within months.
Our current drawdown would barely register on this historical chart, appearing as a small dip. However, looking at recent price action in half hour bars, it certainly feels more significant:
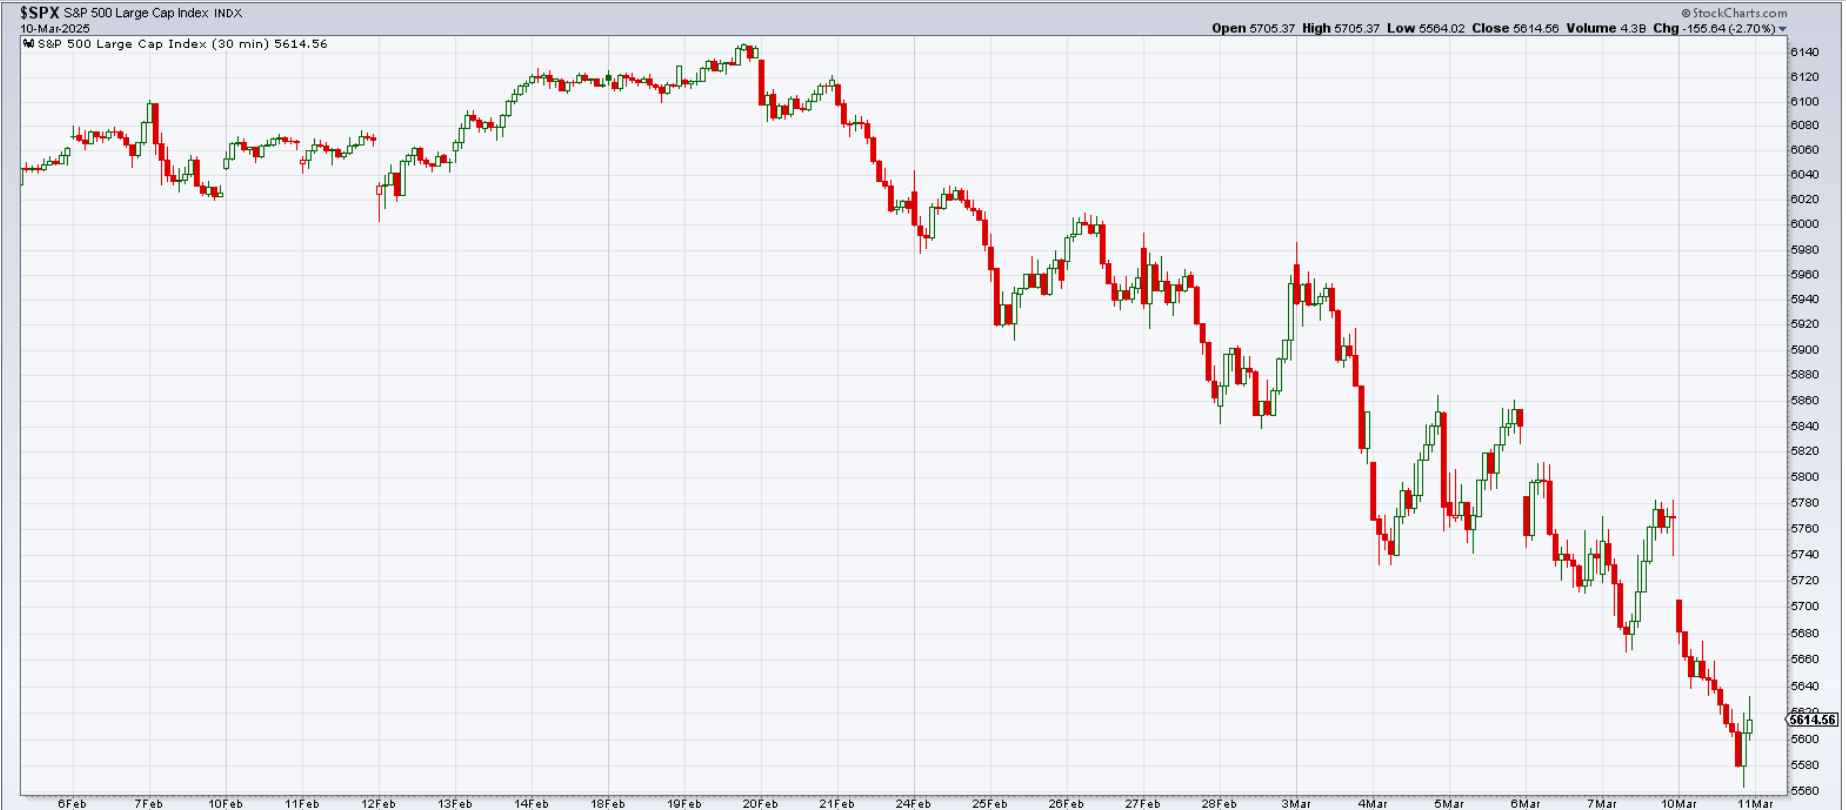
The steep, extended declines create anxiety, and market commentators fuel uncertainty about how long and deep this correction might be. The honest answer is: we don't know. It may be over already or could continue for some time.
Maintaining Long-Term Perspective
I want to shift your focus from short-term market movements to the long-term picture. While none of us have been investing since the 1950s, most have been in the markets for some time. Looking at the system's performance since its inception in 2003, we've consistently outperformed the market while experiencing shorter and shallower drawdowns.

We're currently at a challenging point, but I remain confident that the long-term trajectory will continue upward. Market variation is actually healthy, but if you don't believe that markets will rise over time, equities may not be the right investment vehicle for you.
Final Thoughts
Thank you for your continued trust.
As always, I'm here to help with any questions—reach out anytime at help@GGletter or by phone. My goal remains clear: to provide a market-beating investment system with minimal holdings that works across different account types and requires only about five minutes of management per month. This approach allows you to focus on your life, sleep peacefully, and look toward a wealthy retirement.
Mid March Market Summary
The S&P has declined a maximum of 10.1% in March so far from its February 19 all-time high. Is the decline done? We don’t know but a pause in the decline or a bounce would not be surprising. The market will let us know soon enough.
Because the system moved partly into foreign equities at the end of last month, the system results are down less than the US stock market. We will wait to see what the market does for the remainder of the month and will also see what the system recommends at the end of March.
Note: March 31 is on a Monday. Mondays can be a busy even a hectic day for some folks. If that includes you, would scheduling a small block of time now for the 31st be useful in case the systems changes an investment position? Your call.
Also, I hope to be able to get the system update email to you on Sunday because the data appears to be updated over the weekend. Even if so, I’ll send an early Monday morning email out.
Take care and be well.
RJ