Five Signals That Tend to Flash Before Market Shifts
Ever notice how market headlines can make you nervous one day, then confident the next day? Today, we'll skip breathless headlines and examine five signals that have historically appeared before major market turns. Three tend to show up months or years ahead. Two appear in the final innings, sometimes just weeks before things shift.
None of these work like magic and none have total dependability - the market's too complex for that. But taken together, they paint an interesting picture. I can try to guess about a top based on the signals but instead, my main focus remains on understanding market weather right now as it suggests the kind of conditions that are most likely to develop next.
Signal #1: The Market's Price Tag
The Shiller PE ratio shows how expensive the market looks compared to long-term earnings—essentially telling you if you're paying $20 or $40 for every dollar of profit. We've seen the highest peaks in the ratio before major bear markets started in 1929 and 2000. Here we stand in 2025 at the second highest level in history.
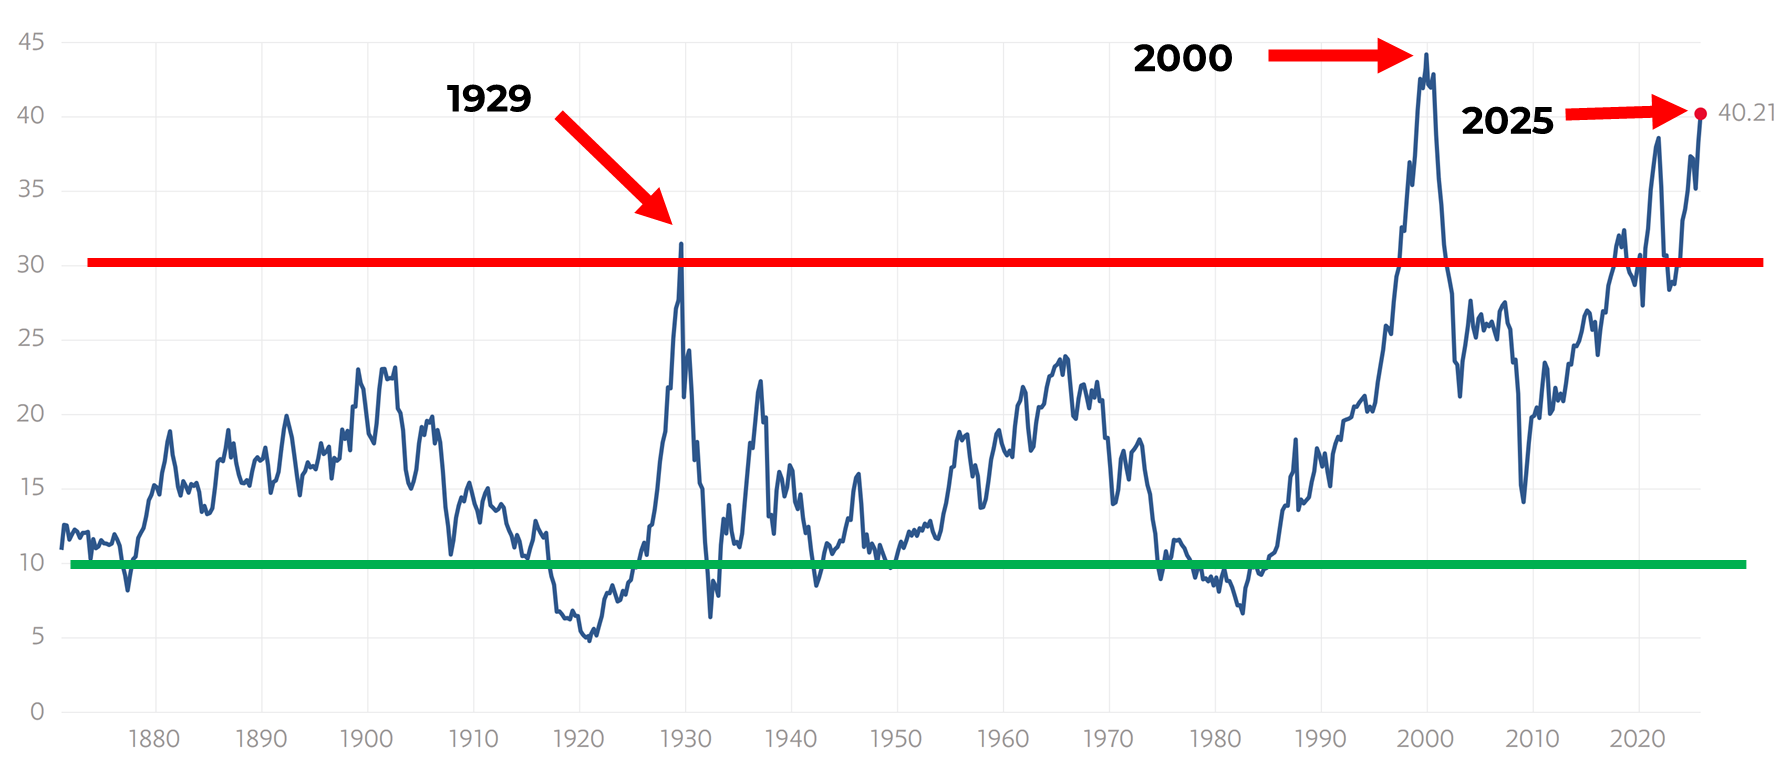
Does that mean a bear market's coming soon? Maybe. What it definitely means: we have a clear signal of elevated market risk. A market PE above 30 has warned months or even years ahead of major market shifts. When prices stretch too far from earnings, financial math tends to pull them back eventually - though the timing? That's always a question.
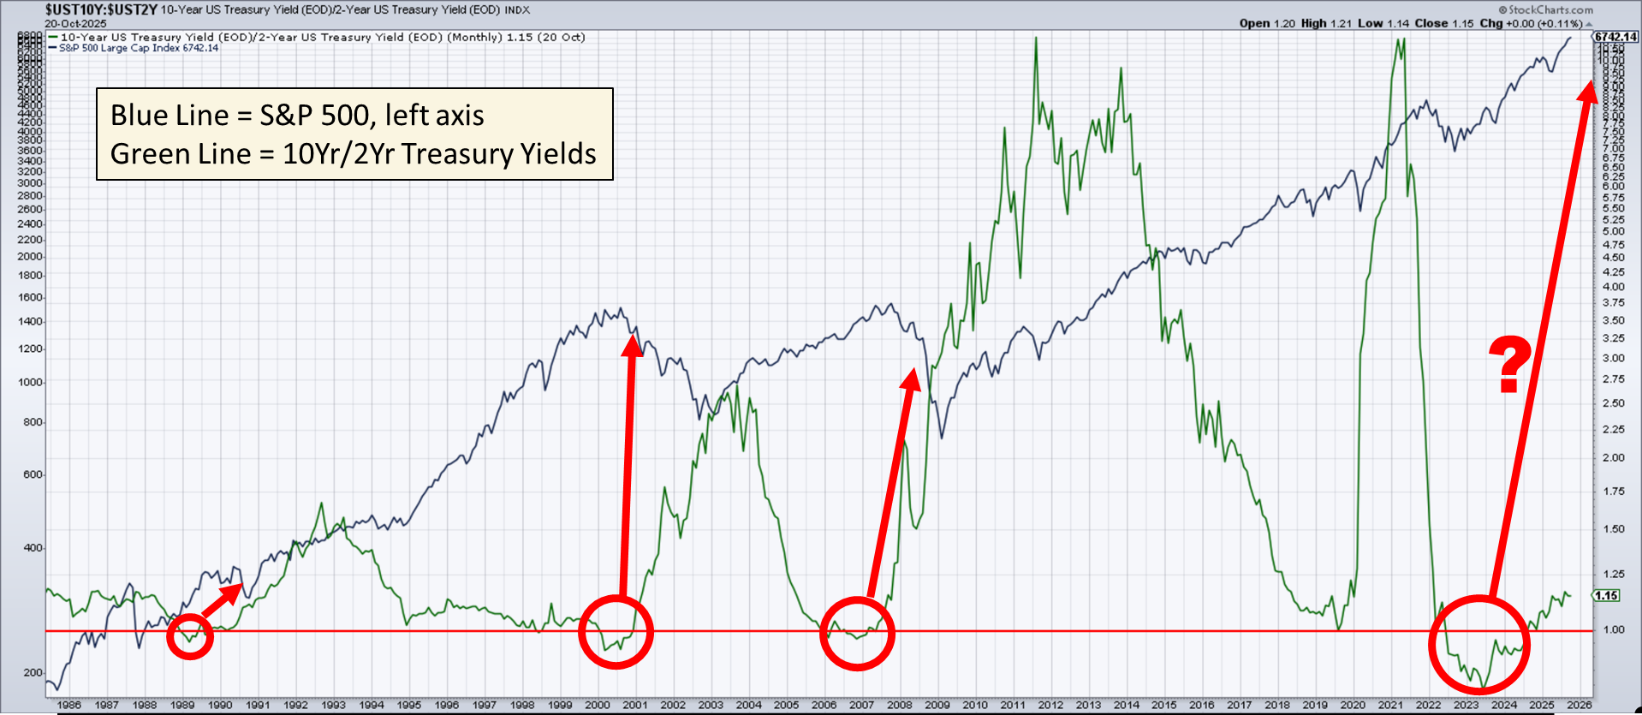
Signal #2: Bonds Flashing Yellow
The 2-year Treasury yield reflects the Fed's economic pressure - think of it like a brake pedal. Think of the 10-year yield as a measure for investor confidence about the future. When the short-term rate rises above the long-term one, braking pressure overpowers confidence, creating a flashing yellow light that has preceded almost every major market decline in recent history.
This pattern appeared before market drops in 1989, 2000, 2006, and 2023, with roughly 90% probability of a 20%+ decline within two years. Right now, the curve has been coming out of an inversion since 2023, and we're approaching the two-year mark. Will this time prove different? We'll see.
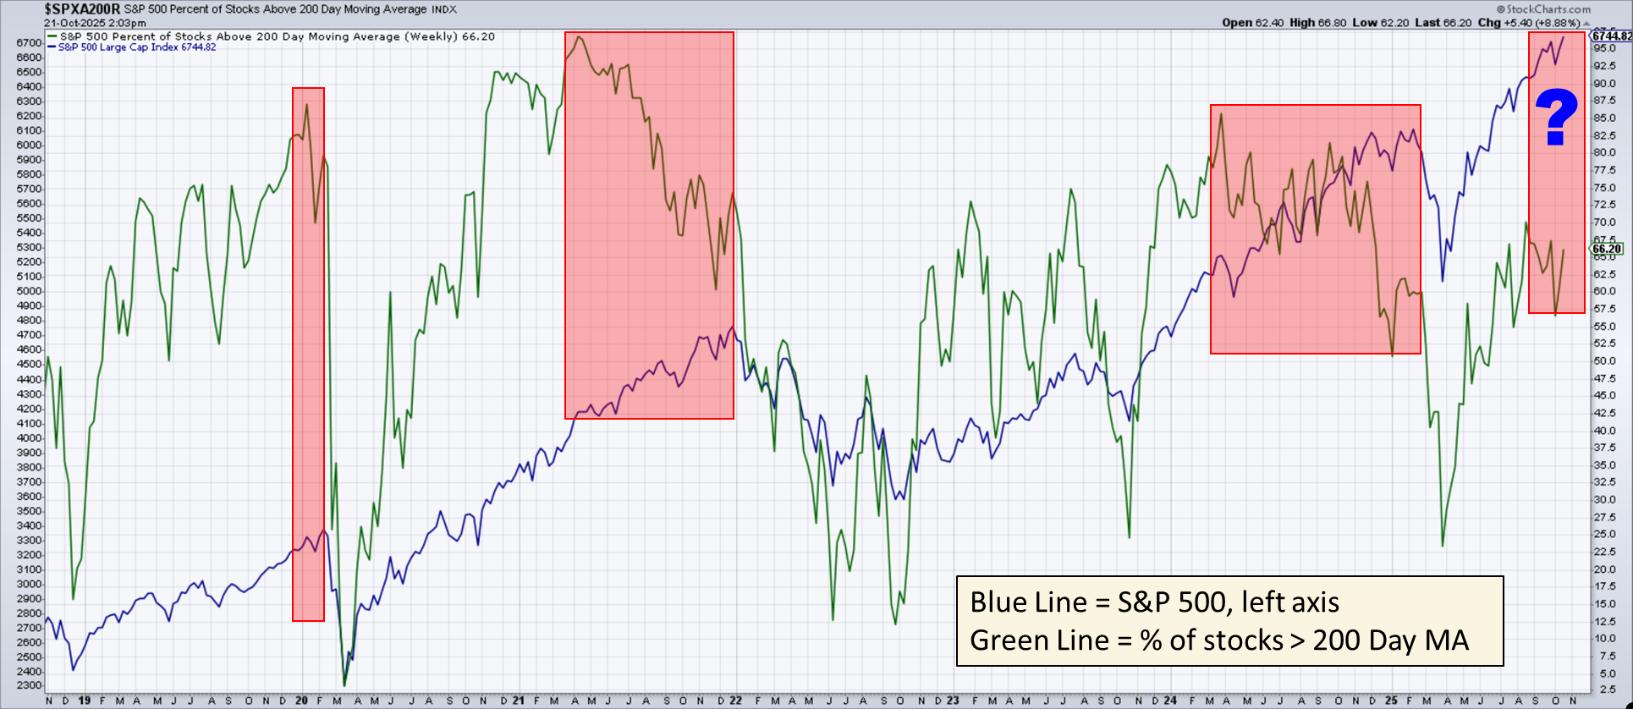
Signal #3: Who's Carrying the Load?
Market breadth measures how many stocks are rising versus falling. Imagine a parade where 1,000 people started marching, but now only 50 are still walking. The music still sounds fine, but something's off. When the percentage of stocks above their 200-day moving average drops while the index keeps climbing, the rally may be running on fumes.
We saw this a few months before the March 2020 COVID crash, before the 2022 decline, and again early this year before this year's March dip. It doesn't mean the top has arrived, but it often appears weeks or months beforehand. When fewer stocks carry the load, the foundation softens underneath
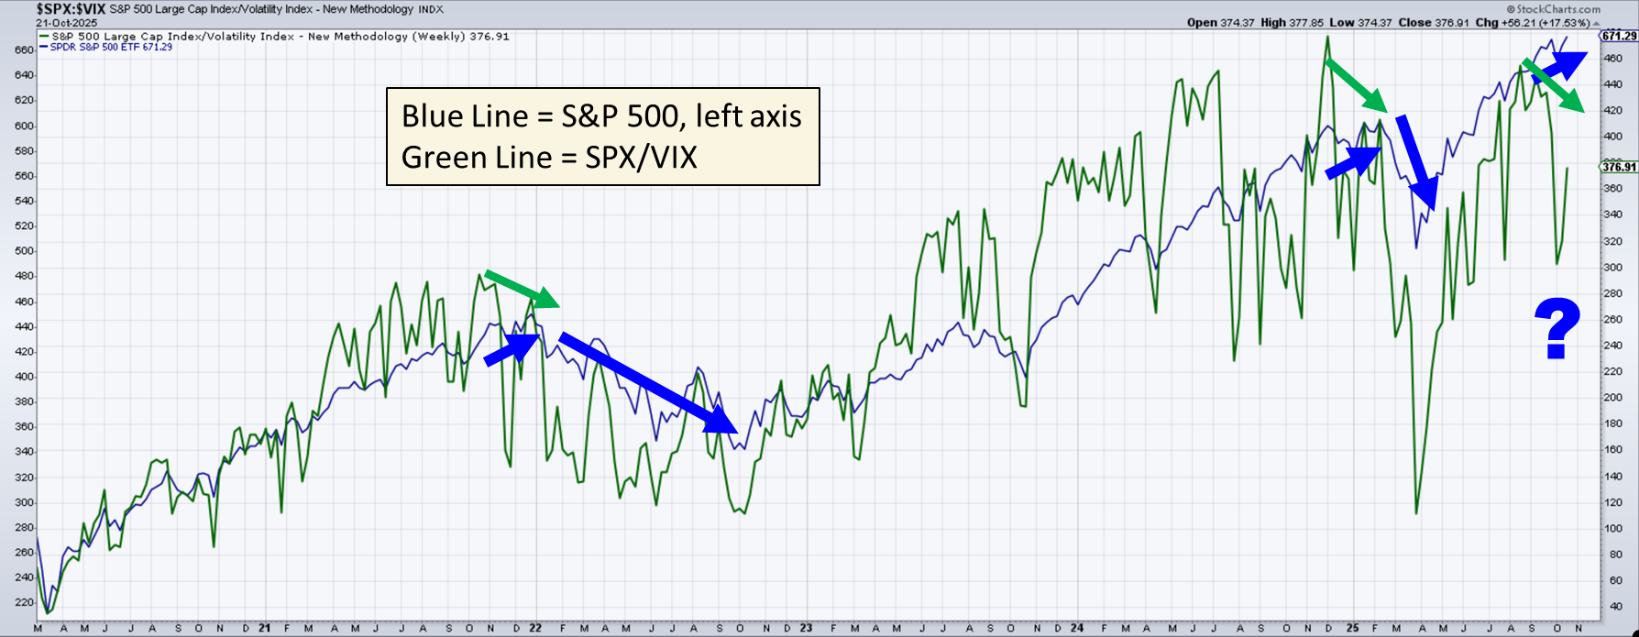
Signal #4: Rising Nerves Beneath Rising Prices
Those first three signals give us a few or more months of warning. Now let's talk about what happens in the shorter term. When volatility (measured by the VIX) rises faster than stock prices, institutional investors are buying protection in the options market - a sign of rising anxiety beneath those rising prices. Very often, volatility increases in the last stages of a bull market before prices roll over. We saw this in late 2021 and again in January 2025, weeks before March's decline. When anxiety rises faster than prices, a shakeout often follows.
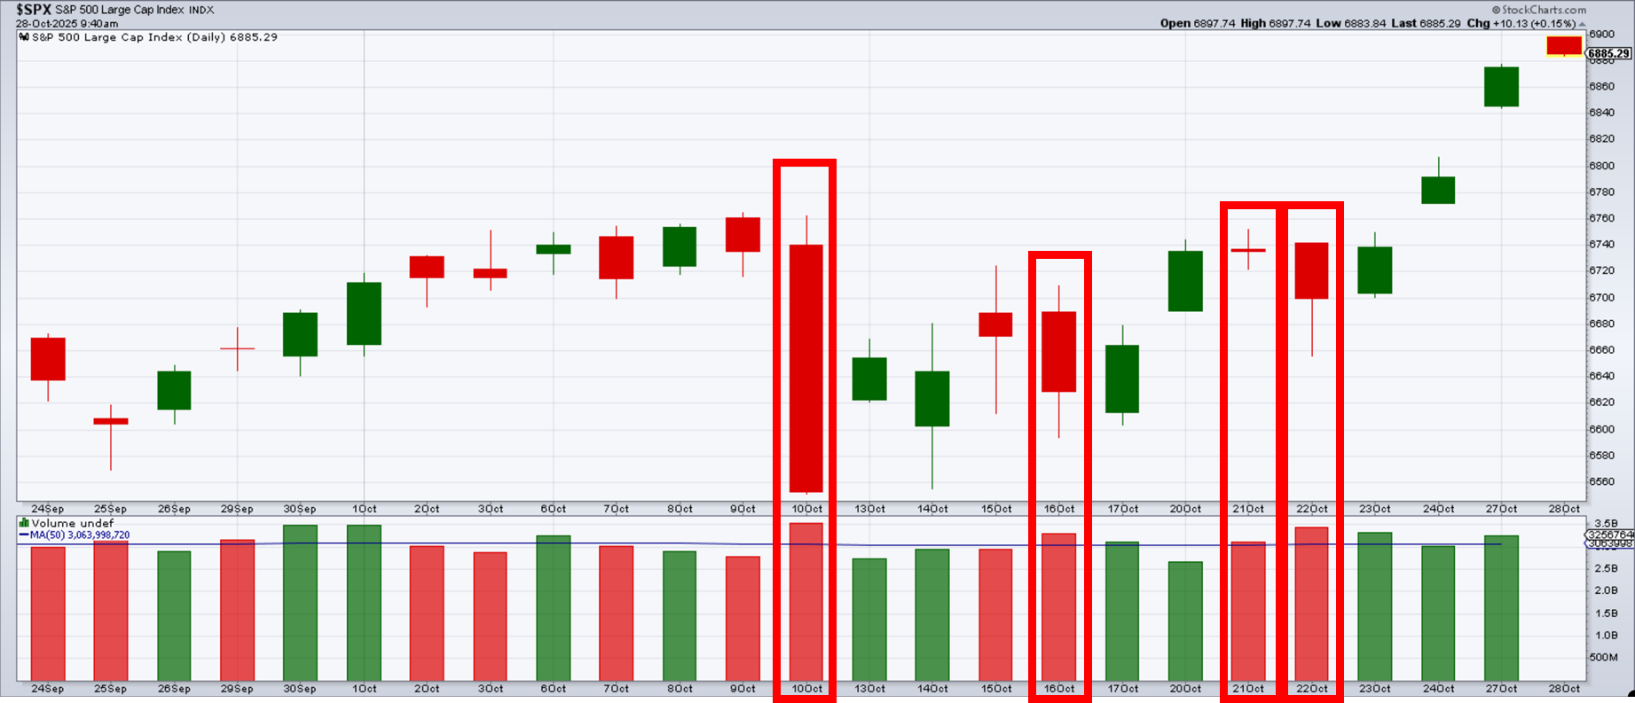
Signal #5: Quiet Selling into Strength
A distribution day happens when higher-than-average volume combines with the market closing down at least 0.25%. This suggests institutions are unloading shares while prices still look fine. The rule of thumb: six to nine distribution days within a month often marks a rally's end. As of late October 2025, we've logged four - below the threshold, but worth continuing to monitor. When big money sells into strength, the energized crowd doesn't tend to notice until later
A Personal Shift in Perspective
Let me share something that surprised me while pulling this material together. I used to track market progress constantly, watching lots of indicators, trying to stay one step ahead. Looking back, I realize now that routine may have created more stress than clarity. I was trying to shore up my confidence about how to handle positions.
What struck me this week: how much less interested I am in these signals now. Yes, it makes sense to keep an eye on the market and understand where we sit in the cycle. But systemizing my investing instead? That has proven a much more fruitful effort than frequent tracking.
If you want to track these five signals or any others frequently, that's fine! Certain people enjoy that, but for most of us, it's unnecessary. Even if you had developed the skill to make great market calls consistently, your plan and execution still produce the actual results.
These days, I let the SmartSignal System do the heavy lifting, adjusting and shifting month by month – instead of trying to predict tops and bottoms.
The Bottom Line
So where does that leave us? If you're wondering whether the market sits near a top, I'd say yes, probably. How soon? Can't say beyond very soon to pretty far out. Will it be a major market top or just an intermediate bull market peak followed by a correction? We’ll only have an idea after it gets going.
More importantly, here's what I do know: worrying about market tops may indicate the lack of a good plan about how to adjust to market conditions as they evolve. A systematic approach enables you to stay prepared regardless of what comes next . . . and maybe then you can stop losing sleep trying to predict what comes next.
Stay calm, stay informed, stay on plan.
+++++++++++++++++
Important Disclosures
Past performance does not guarantee future results. Investing involves risk including the possible loss of principal.
The performance shown combines two different kinds of data. Results from January 2003 through December 2024 reflect backtested application of the SmartSignal methodology to historical price data. Results after January 2025 reflect actual signals delivered to subscribers during that period.
Backtested performance has inherent limitations. It does not represent actual trading. Backtested results benefit from hindsight and do not reflect the impact of trading costs, execution slippage, market liquidity, or the psychological pressures of investing real money during live conditions. For these reasons, backtested performance may differ materially from actual results. Individual subscriber results may also vary based on execution timing, account composition, and other factors.
TenHundred Co., its officers, employees, and partners may hold positions in the ETFs or securities referenced by the SmartSignal methodology, and may trade those positions without notice. TenHundred Co. reserves the right to modify or discontinue the methodology at any time, and past performance data may not reflect the current methodology.
Growth Guardian Investor publishes systematic investing education and methodology training under the publisher's exclusion to the Investment Advisers Act of 1940. We do not provide personalized investment advice. Subscribers make their own investment decisions.
Full Disclaimers Statement on www.gginvestor.com.