SmartSignal System Report, June 2025
The Smart Signal System turned in a solid month. Here's the performance breakdown across different timeframes:

So, a nice rebound in June after a modest start to the year.
In the twelve month relative performance chart, you'll notice the S&P 500 (in red) dipped during Q1, bottomed out in early April, and has since climbed. The index for foreign stocks (in blue) shows a similar trajectory, also bouncing sharply since the April 8th low.
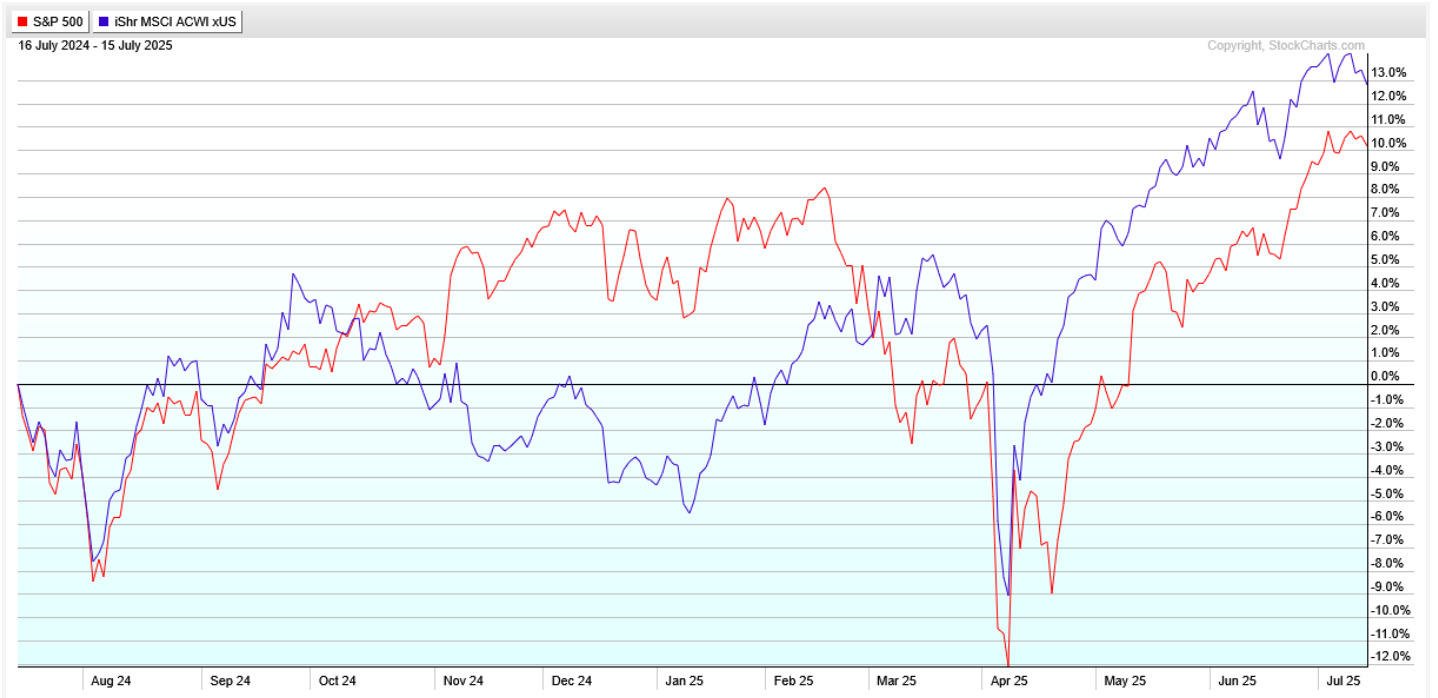
Right now, U.S. and foreign stocks are pacing each other closely. Despite renewed tariff talk in the news, neither market has shown major weakness in response—something to keep an eye on in the coming weeks.
Market Update
This performance ties directly into what we're seeing in the broader market. Let's move from system numbers to what's happening overall.
First up, the S&P 500 monthly chart (on a log scale) going back 20 years. You'll spot the March–April dip in the top right, followed by a strong bounce. The index hit a new all-time high on June 27th—and again on July 10th. So from a price standpoint, the trend looks solid. Not euphoric, but reasonably strong.

Now, let's peek under the hood at market health. A great breadth indicator continues to be the percentage of stocks above their 200-day moving average. Last month, we looked at this with an overlay showing a "caution zone" and a "weakness zone." At that point, we sat in the middle of the caution zone. Now, we've moved toward the upper end of that range.

Now in the high forties, nearly half the stocks in the index trade above their 200-day moving average and the rest are below. Think of 55% as a tipping point—if we move above that level, it would suggest broadening strength and a higher likelihood for a continued trend up in the near term.
With market breadth still mixed like this, it's worth examining what's actually driving the recent gains. So what's propping things up right now?
No surprise—it's the Magnificent Seven again. You'll see that in the twelve month relative performance chart below. The S&P line (in red) shows a mild ride in the last twelve months: a rise, flattening, dip, and then the recent climb. The blue line, which represents the Magnificent Seven (Apple, Amazon, Nvidia, Tesla, Microsoft, Broadcom, and Meta), tells a more dramatic story. These stocks dropped hard late last summer, surged through year-end into early 2025, and then declined (crashed?) before rallying recently.
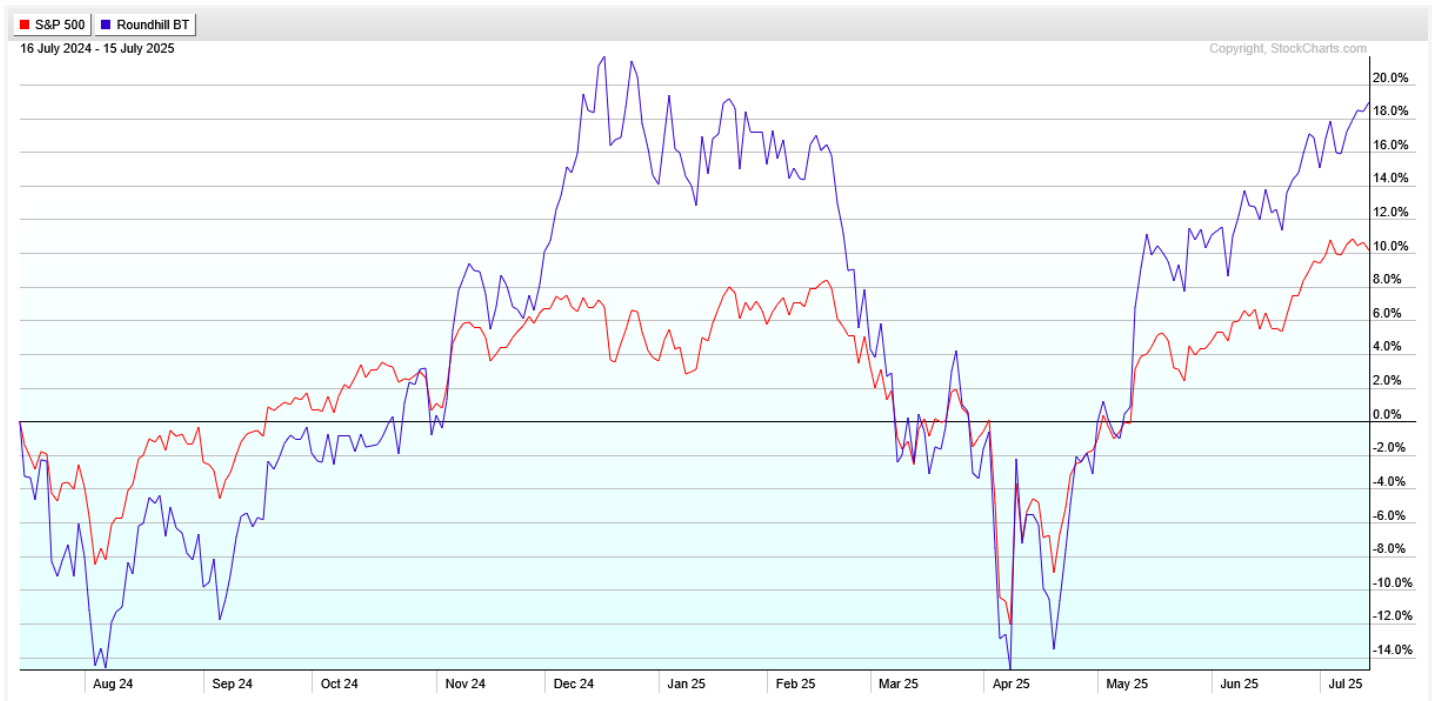
That volatility shows how much weight these mega-cap names carry. Even with 500 stocks in the S&P, these seven exert huge influence because the index weights companies by their size—the bigger the company, the more it affects the overall index. If they continue trending up, they could continue to pull the S&P with them.
We're also entering earnings season, and although only a handful of companies have reported so far, 70–80% have delivered both revenue and earnings-per-share surprises. That kind of strength—if it continues—will offer support even amid geopolitical uncertainty like the tariff headlines.
The Big Picture
This current market strength raises an important question about sustainability, which brings me to a fascinating perspective from veteran investor Jeremy Grantham. Let me highlight a conversation worth your time: an interview with him titled "How to Predict a Stock Market Bubble." You can find it on YouTube with a quick search.
Image from: https://www.youtube.com/watch?v=RfN7eFo5cbk
Grantham has managed large amounts of money for decades and never seems to have minced words in public. He stepped away from active portfolio management about 15 years ago so he feels freer to say what's really on his mind.
He believes we're in a bubble right now. His reasoning? When a genuinely transformative technology arrives, it inspires genuine belief among investors, institutions, and the public in its transformative abilities. The result: large-scale investment. And since we tend to lean optimistic in good times as a species, that investment turns into overinvestment which eventually leads to a correction.
He pointed out that the current U.S. stock market sits at the highest valuation in history. To give you some context, he listed the four previous biggest peaks in valuations - all lower than ours right now: 1929, 1972, 2000, and 2007. None of those years spark warm, fuzzy memories for investors.
If someone asked you, "Would you rather be entering or exiting the market during any of those years?"—most of us wouldn't hesitate to say "exiting."
Still, Grantham made a key distinction. Even though he sees our current market as being a bubble, he said the market looks fine in the short run—over the next couple of months or maybe even a few quarters.
His concern lies in the intermediate term. He believes a sizable group of investors—possibly many—will look back a few years from now and wish they'd moved to cash around now.
When asked directly whether individual investors should go to cash, Grantham brought up what he called the "amateur advantage."
Unlike institutional managers who must answer to clients, committees, and hedge fund partners, individual investors have more degrees of freedom. Grantham felt comfortable with individuals shifting holdings to cash now—or reallocating to foreign stocks which appear less overvalued than the S&P.
Here's where Grantham's points become directly relevant to what we're doing.
The SmartSignal System removes the guesswork and emotional toll from decisions like this. We don't have to predict when the bubble pops or whether it inflates further. The system operates systematically (no pun intended). If and when it detects risk, it will signal us to move out of the riskier asset (stocks likely) and when conditions improve, it will signal us back in.
That removes a huge psychological burden of investing. It also avoids the all-too-common mistake of trying to time market tops based on a gut feeling or market news. Grantham acknowledged that he has consistently been early in judging when the market tops. While that has upset some of his investors at times, it has also led to decades of longevity for him as a profitable money manager.
So while I find Grantham's perspective insightful and it aligns with some of the broader valuation concerns we've discussed, I take it in as useful context rather than a call to action now. The system stays in control and will call the action when appropriate.
That wraps up this month's report. Keep an eye on earnings in the coming weeks and how the market responds to any surprises.
Closing
Thank you for your business!
If you have friends or family who might benefit from a system that mostly sidestepped the market's recent 20% drop, feel free to forward them this email, or send me their info and I’ll follow up. As always, if you have questions, reply to this email or text/call. I’d love to hear from you. Take care,
RJ
*Important Disclaimer: The information contained in this email is for educational purposes only. I am not a registered investment advisor, broker, or dealer, and I am not licensed to provide personalized investment advice. Nothing in this email should be construed as an offer, solicitation, or recommendation to buy or sell securities or any other financial instruments.
All investments involve risk, including the loss of principal. Please consult with a qualified financial advisor, tax professional, or legal counsel before making any investment decisions. The content of this email is not intended to replace professional advice tailored to your individual circumstances.