March, 2026 SmartSignal Report, Market Overview, and Big Picture
The Numbers
The long-term SmartSignal numbers look solid: 10.9% compound annual growth over fifteen years, 8.9% over five years, and 15.9% over the past twelve months.

Year-to-date? Down 1.2% through March. The one-month return hit minus 11%. Ouch!
That single-month number might look alarming but context matters. Last month, our twelve-month return sat at 26% and YTD sat at 11% . We’ve been riding strong gains for the last few months and March brought us back a bit – though the net returns remain strong.
You can see what happened in March when you look at the two holdings. The S&P dropped 5% for the month -and actually fell as much as 8% at one point before recovering slightly. Gold, meanwhile, fell 18% at its lowest point during the month but finished down 12%.

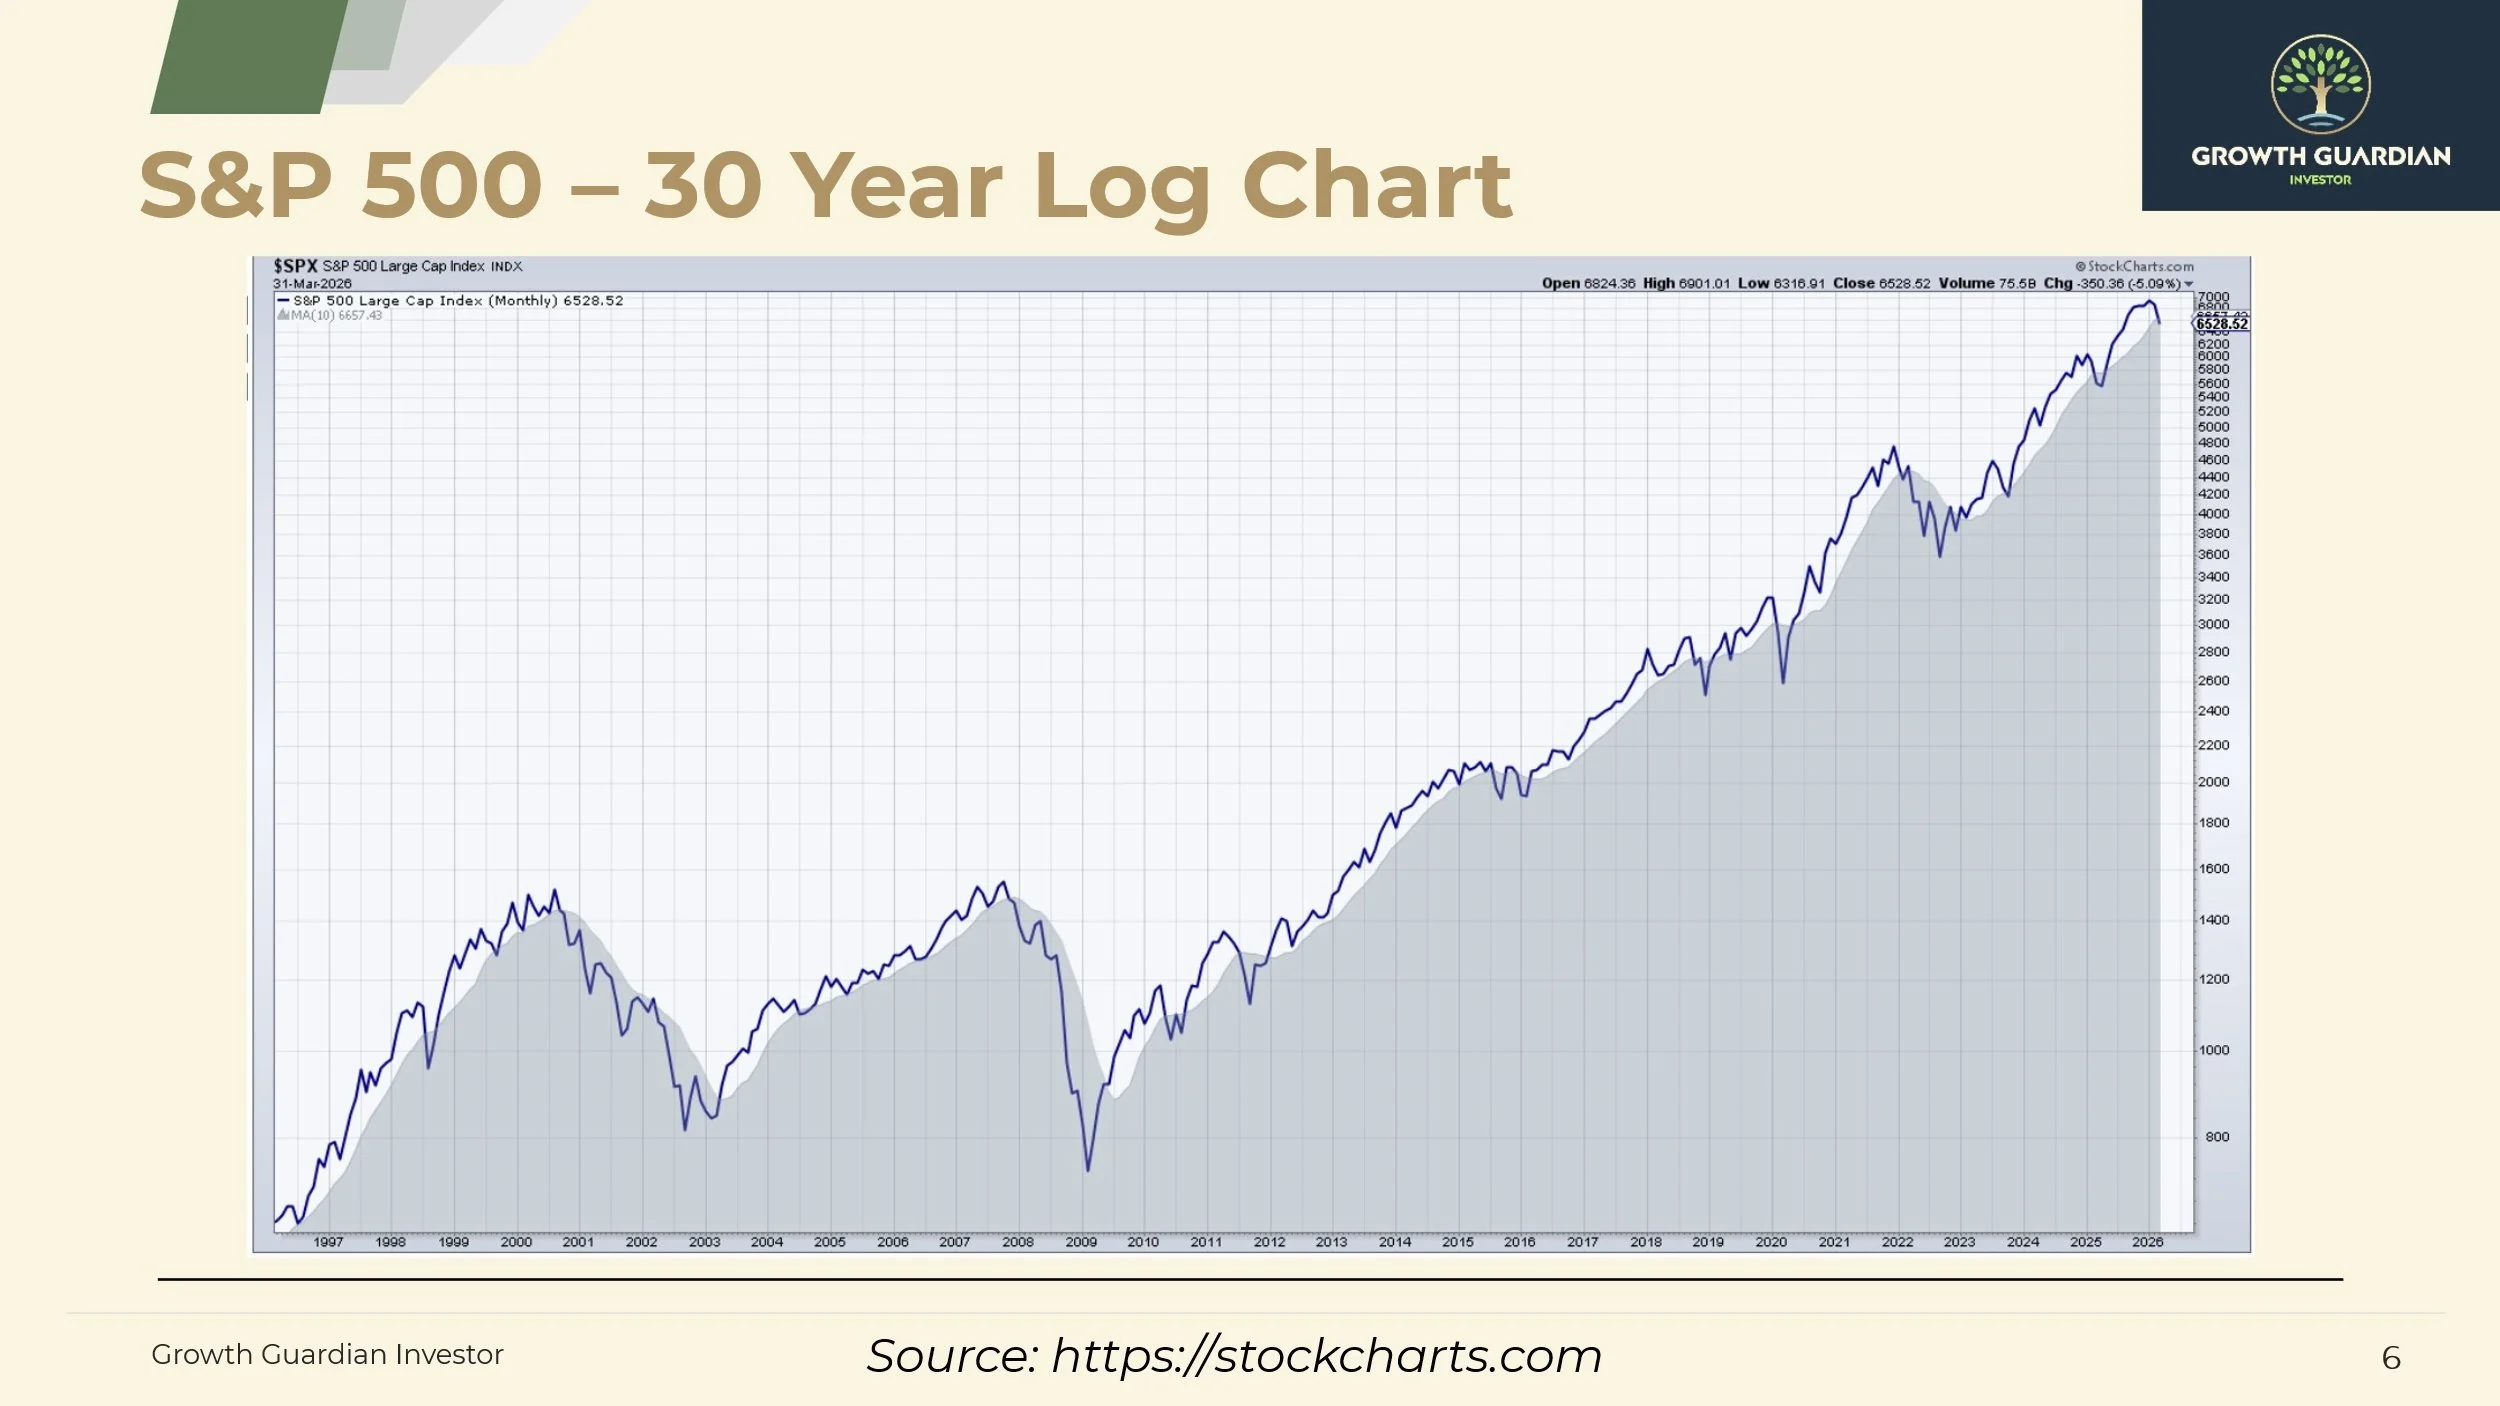
Source: stockcharts.com
Gold had hit an all-time high back in January, so this pullback comes after a significant run-up. The system turned defensive in response, which means we’re sitting on the sidelines for a bit.
Market Update
The thirty-year chart shows the market rolling over from recent highs.
The five-year weekly chart reveals this more clearly—those last four or five bars represent March.
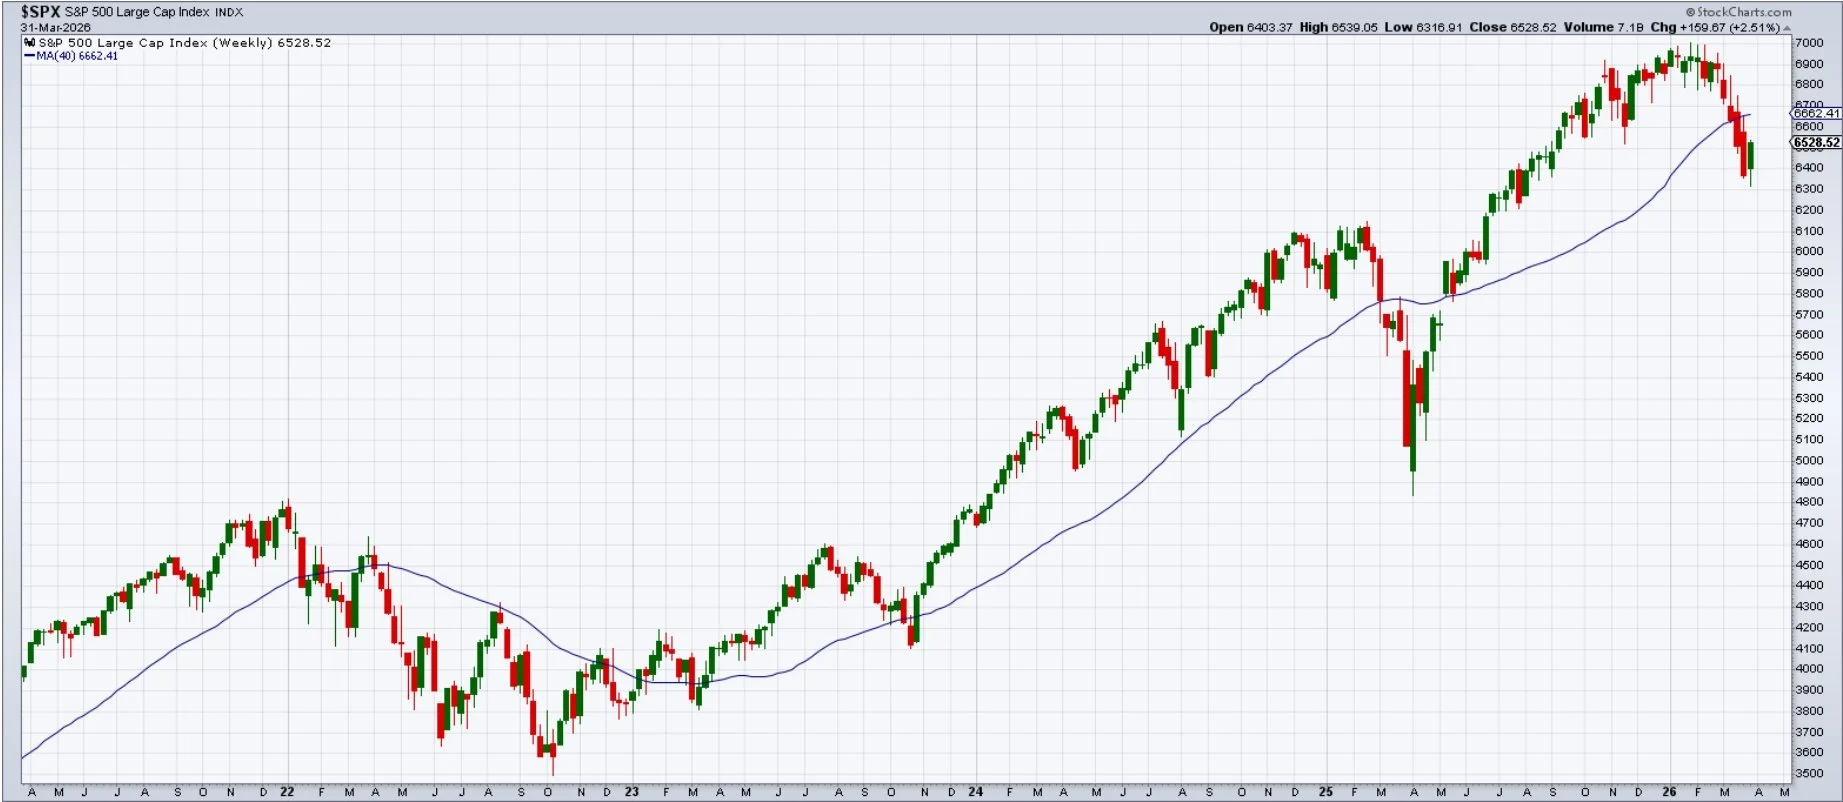
Source: stockcharts.com
The market dropped below its two-hundred-day moving average, which usually signals something worth noting. Does it keep falling or bounce back?
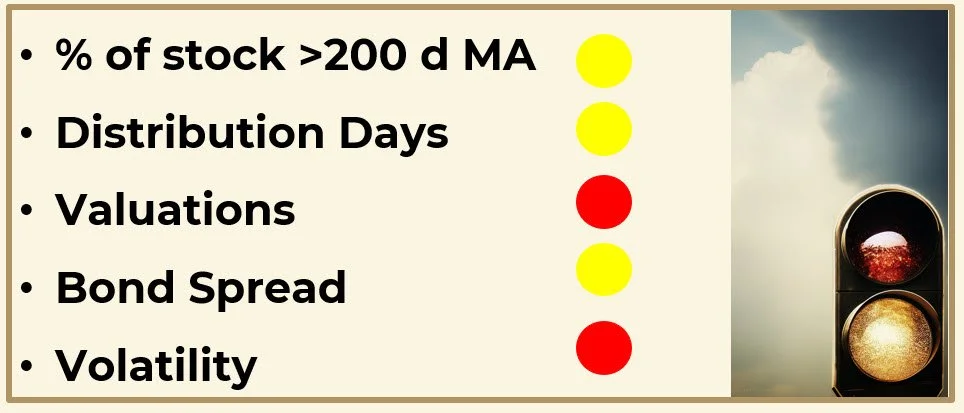
The directional indicators I typically watch might offer some help. But given the military operation in Iran, headlines are driving market action more than technicals. I’d call this yellowish-red, but wouldn’t place much faith in the indicators right now.
Big Picture: To Diversify or Not to Diversify? That is . . . not exactly the right question.
With stocks down hard over the past five or six weeks, I wanted to revisit an old friend: diversification. Specifically, I’d like to make two cases that might surprise you.
Case 1: The Fall of 2008
Think back to October and November 2008. Bonds, gold, the S&P, junk bonds, emerging markets, real estate—almost everything dropped together. See the green S&P line in the chart below. It actually landed in the middle range of losses. Real estate fell hardest.

Source: https://proactiveadvisormagazine.com/understanding-crisis-correlation-risk/
This chart shows a great example of “crisis correlation risk”—when everything moves down together. The idea that diversification has some things going in a different direction that other things in the portfolio fails at the worst times – at the times when you need it to work most. Someone holding all of these varied assets watched their diversified account fall. Everything fell.
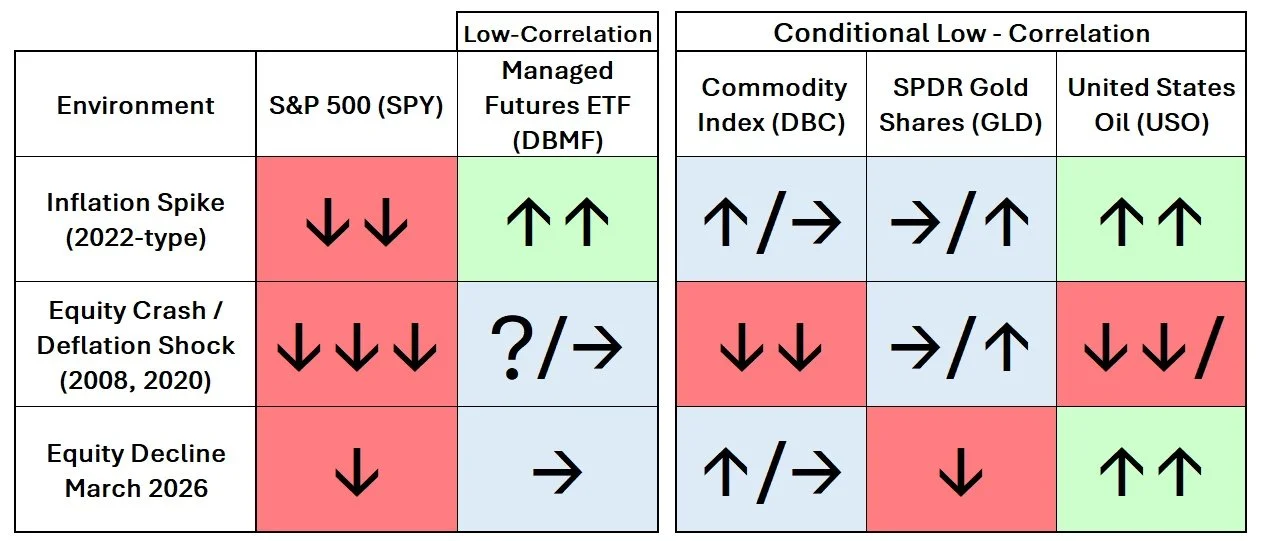
Case 2: February–March 2026
Fast forward to the past five weeks. The S&P, foreign equities, bonds, small caps, emerging markets, junk bonds, real estate, and gold. Crisis correlation risk shows itself again. Everything had dropped 1% to 7% by March 31. Nothing finished at break-even.

Source: stockcharts.com
When diversification matters most—when you need some holdings to go in the other direction or just not go down, traditional diversification across asset classes tends to fail.
A Better Way
But what if another type of diversification exists?
Rob Hanna, a researcher and money manager, puts it well: “To better improve their chances of avoiding a substantial drawdown, investors should consider not just alternative asset classes, but also alternative strategies.”
When Hanna uses the term “alternative,” he’s talking about going beyond the standard stocks-and-bonds approach. In the old days, accessing strategies in alternatives - commodities, futures, long/short approaches - meant hiring a professional money manager. You’d have to place your money with someone who did this full-time, which added layers of complexity and cost. Most individual investors couldn’t access these strategies directly.
But . . . ETFs
The development and proliferation of ETFs has changed this landscape, making alternative strategies accessible to individual investors. ETFs have moved into these areas over recent years, opening up possibilities that used to require institutional access. Here are three categories worth understanding (not recommendations—just education):
Managed Futures ETFs like CTA, DBMF, and KMLM invest in various futures market strategies.
Long/Short Strategies like BTAL aim to profit in both rising and falling markets.
Conditional Alternatives like DBC (commodities), GLD (gold), and USO (oil) sometimes show low correlation with stocks—and sometimes don’t. Their behavior depends on what’s driving the market down and so are labeled “conditional”.
Managed futures like DBMF show little to no correlation with stock market drops. Some conditional alternatives also hold up in specific situations. But they don’t always provide protection—it depends on the type of downturn.
This approach can get complicated fast. You’re diversifying across asset classes, strategies, and time frames. The complexity factor sets in quickly.
One More Alternative
Dynamic allocation strategies offer another path. The SmartSignal system uses this approach which actually concentrates holdings in one or two areas but move among asset classes in response to market conditions.
Rather than trying to maintain static positions across multiple assets, dynamic allocation adjusts holdings based on what’s going up and what’s going down. When conditions look favorable in one area, you’re in. When they don’t, you step aside. What happens if everything goes down at the same time? It goes to cash – as it did recently. This presents different way to think about the promise and challenges of diversification.
This differs from staying fully invested – even if you diversify across assets. Bill and will I discuss several systems that maintain a low-correlation with equities in our upcoming book, Smart Is Not Enough.
Until then, take care.
+++++++++++++++++
Want more guidance like this? The Growth Guardian Investor newsletter is free and built for self-directed investors approaching retirement.
Important Disclosures
Past performance does not guarantee future results. Investing involves risk including the possible loss of principal.
The performance shown combines two different kinds of data. Results from January 2003 through December 2024 reflect backtested application of the SmartSignal methodology to historical price data. Results after January 2025 reflect actual signals delivered to subscribers during that period.
Backtested performance has inherent limitations. It does not represent actual trading. Backtested results benefit from hindsight and do not reflect the impact of trading costs, execution slippage, market liquidity, or the psychological pressures of investing real money during live conditions. For these reasons, backtested performance may differ materially from actual results. Individual subscriber results may also vary based on execution timing, account composition, and other factors.
TenHundred Co., its officers, employees, and partners may hold positions in the ETFs or securities referenced by the SmartSignal methodology, and may trade those positions without notice. TenHundred Co. reserves the right to modify or discontinue the methodology at any time, and past performance data may not reflect the current methodology.
Growth Guardian Investor publishes systematic investing education and methodology training under the publisher's exclusion to the Investment Advisers Act of 1940. We do not provide personalized investment advice. Subscribers make their own investment decisions.
Full Disclaimers Statement on www.gginvestor.com.