
SmartSignal Report, Market Overview, Big Picture for February, 2026
SmartSignal System Performance
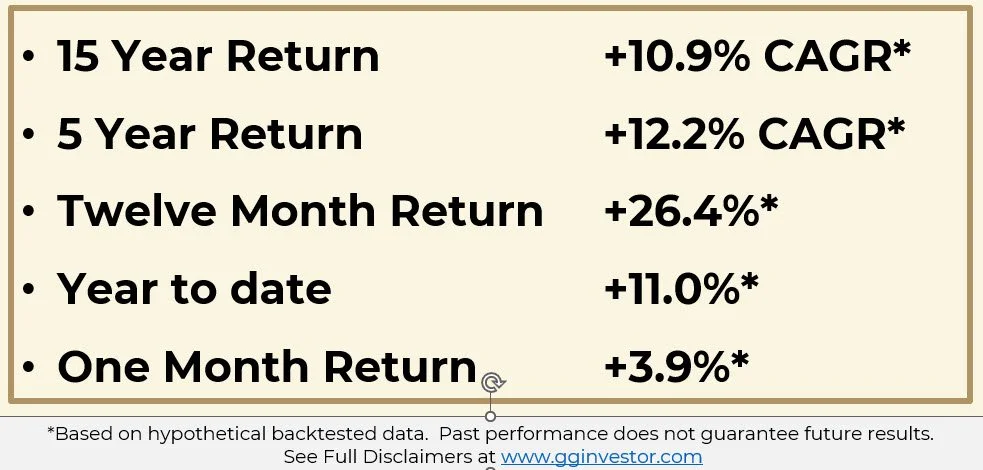
The SmartSignal System delivered another high performing month with a 3.9% return. Year-to-date and the 12-month returns are also very high. As exciting as these numbers seem for the last month or two, remembering that months will come on the lower side helps keep my emotions grounded. As this is a long term investing system rather than a short term trading system, the long-term returns at the top of the table deserve the most focus in better months and in worse months.
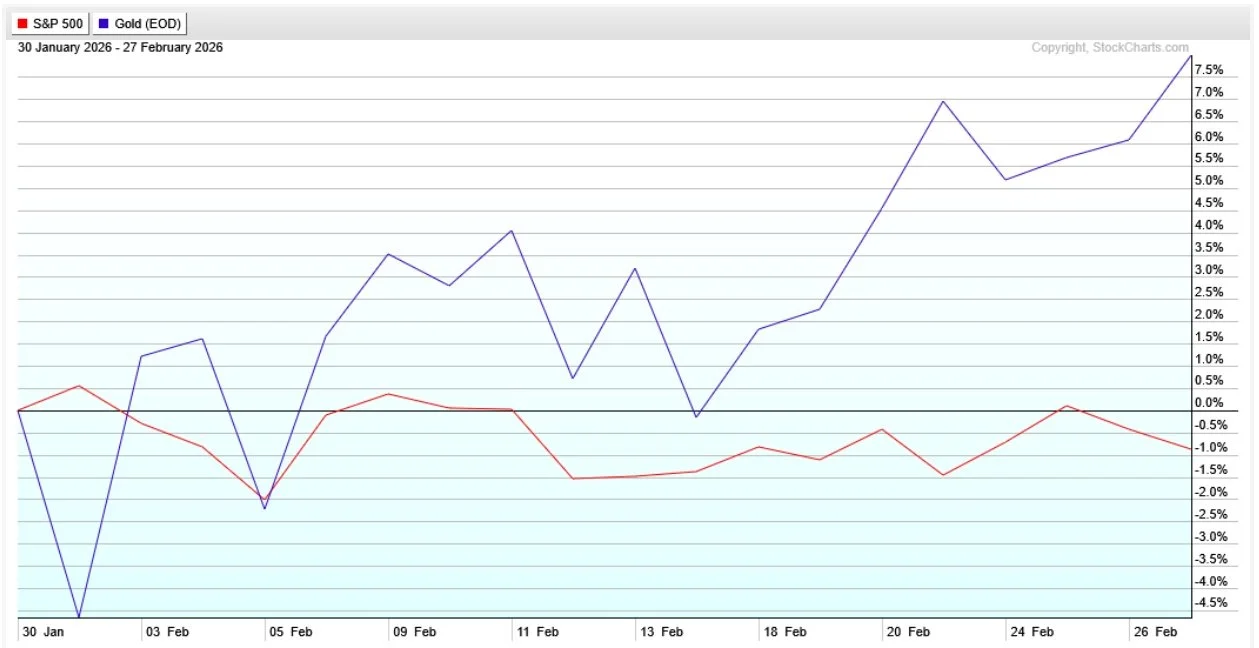
You can see that the gold position was the reason for the return as the S&P lost a little ground during the month -
Source: stockcharts.com
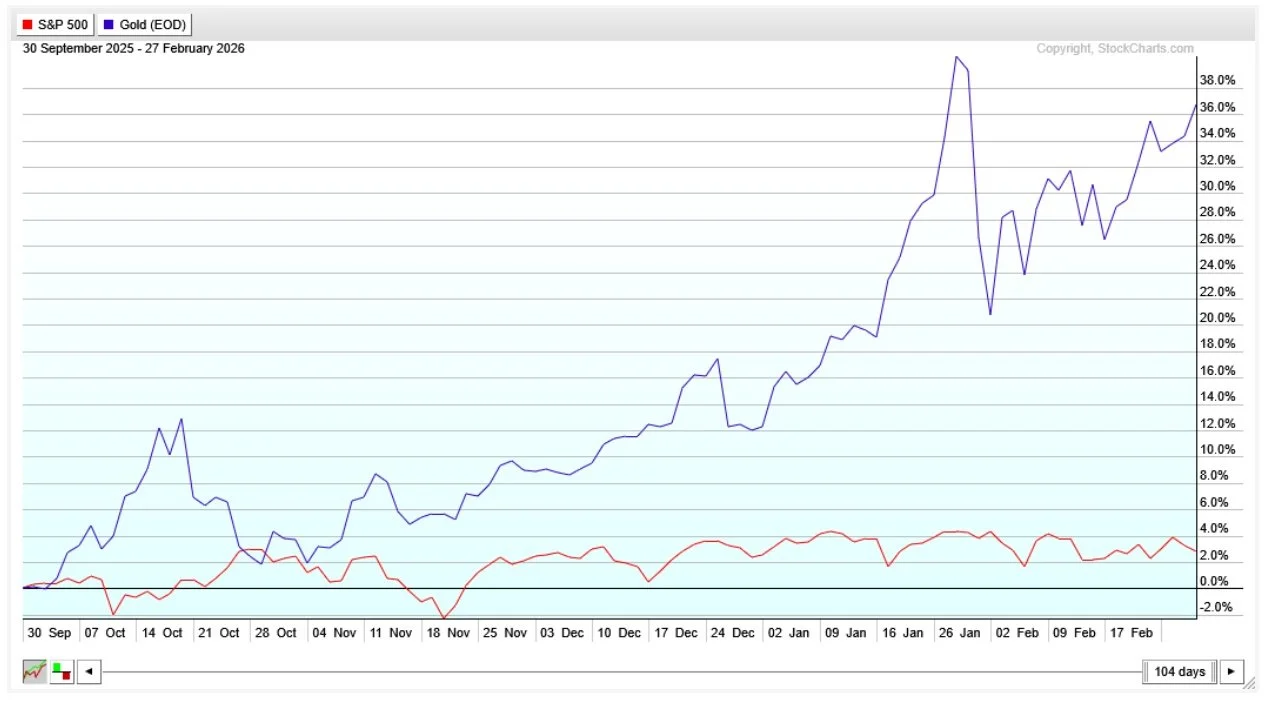
Actually, gold has been driving the system performance for the last few months as you can see in this relative performance chart going back to October -
Source: stockcharts.com
Market Overview
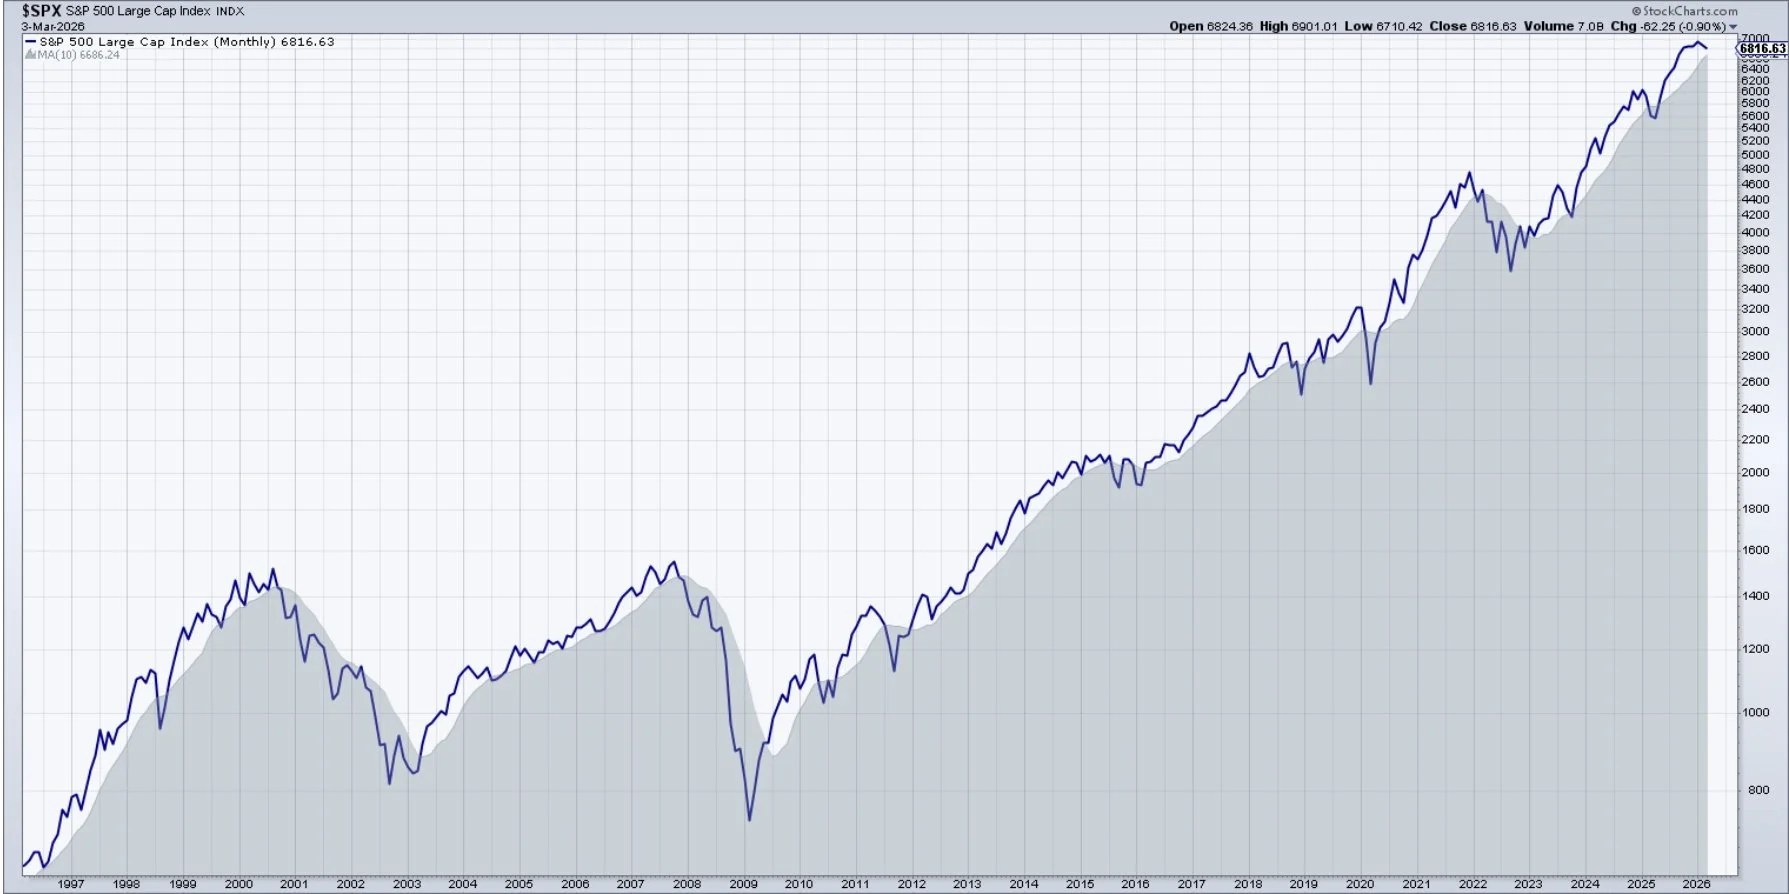
We start the market review with the context setting 30 year log chart for the S&P –
Source: stockcharts.com
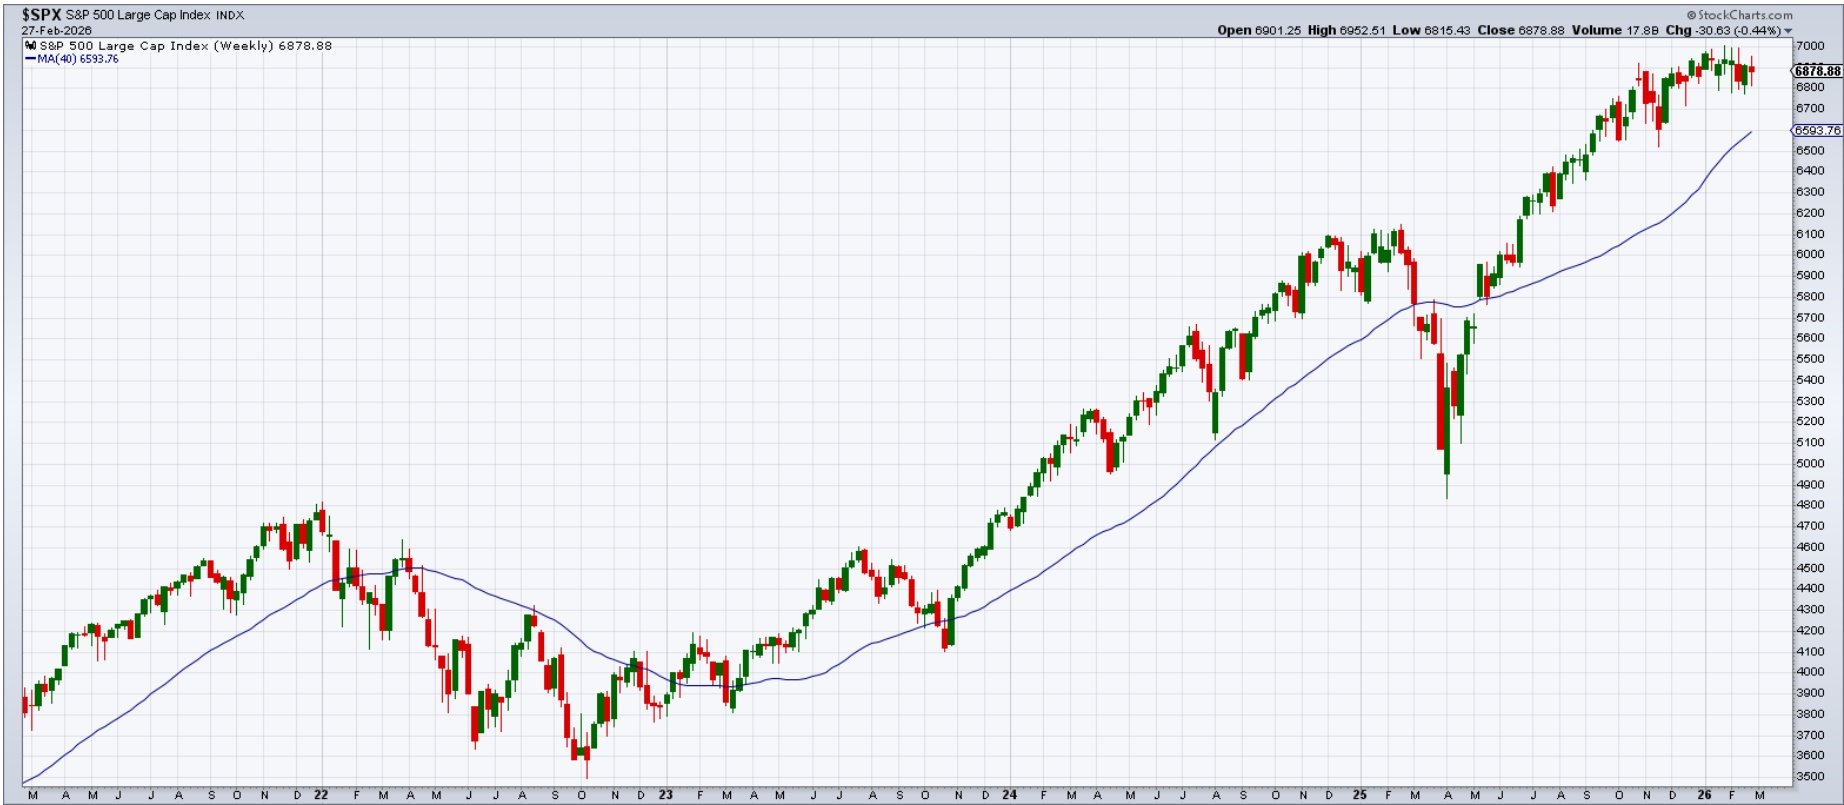
Here’s the 5 year candlestick chart to zoom in on recent price action -
Source: stockcharts.com
Are we seeing the first signs of a rollover in the index or just a consolidation at the current price range? Don’t know and not predicting - just considering how things might develop. The military action in Iran certainly adds some risk to the market. That situation will evolve over the next few weeks and the market action may help people interpret how the military action is going.
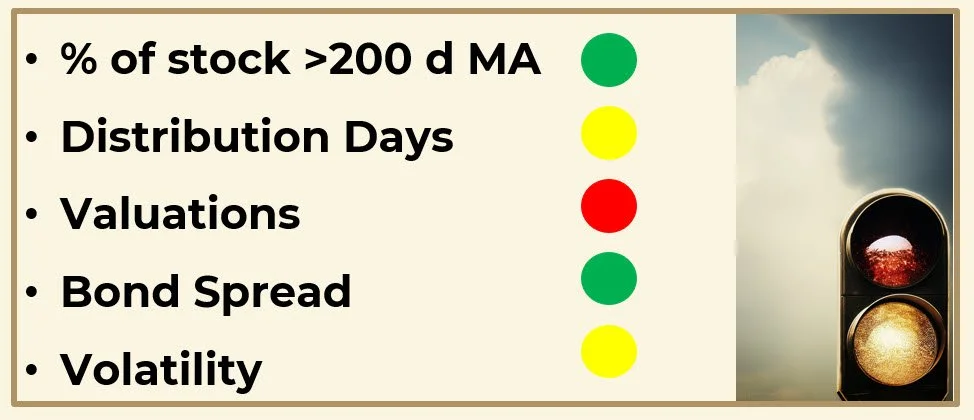
What do some indicators say about the short term direction as of the end of February? Currently, the yellow light shines indicating caution. That context makes this month’s Big Picture especially timely.
THE BIG PICTURE
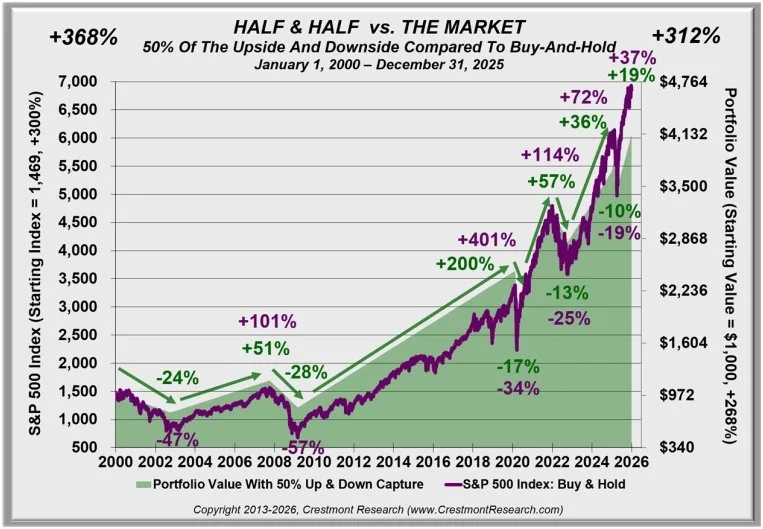
Ed Easterling recently updated many of his pieces with 2025 data (www.crestmontresearch.com) including his essay on half-and-half investing - his term for capturing roughly half the market’s gains while absorbing only half its losses. The core idea translates well into a more intuitive frame that Easterling also uses: sailing versus rowing. We’ll use that frame here.
Reading the Wind
The bull market of the last 15 years has amply rewarded sailors - buy-and-holders who opened their sails to mostly steady, mostly favorable winds. Sailing makes total sense when conditions cooperate.
Right now, however, multiple valuation models - Shiller CAPE, Crestmont’s normalized P/E, price-to-sales, and others - read at historically elevated levels. Nothing predicts a crash; we just read the gauges and consider what the probabilities suggest. They most likely signal a long stretch of light or shifting winds up ahead - conditions where passive buy-and-hold tends to stall or even lose headway.
Hence the question: does our investing strategy fit the conditions we likely find now?
Why the Math Matters
Easterling stresses that investment losses and gains don't operate symmetrically. A portfolio dropping 40% needs a 67% gain just to break even. One dropping only half as much - 20% - needs just 25% to recover. So for long-term returns, we can open a portfolio performance gap compared to the market by reducing the drawdowns during down markets - even if the portfolio lags the market in up markets. In conditions like these, that gap remains ours to open. The time to start probably looks a lot like right now.
Because when wind dies or becomes volatile, sailors need a new approach. Active management tends to earn its keep in bear and volatile markets, precisely when passive strategies lose the most headway.
Two Charts, One Pattern
Take a look at Easterling’s Figure 1 from his essay. The green figures and area graph track the rowing approach. That approach earns half the market’s gains and experiences just half of its losses. The purple figures and line track the buy-and-hold sailing approach - all the gains and all the losses of the market.
Source: crestmontresearch.com
The half-and-half portfolio earned 85% of the market returns for half of the volatility. For investors who’d rather sleep well and enjoy life more instead of riding the market (financially and emotionally), that trade makes good sense.
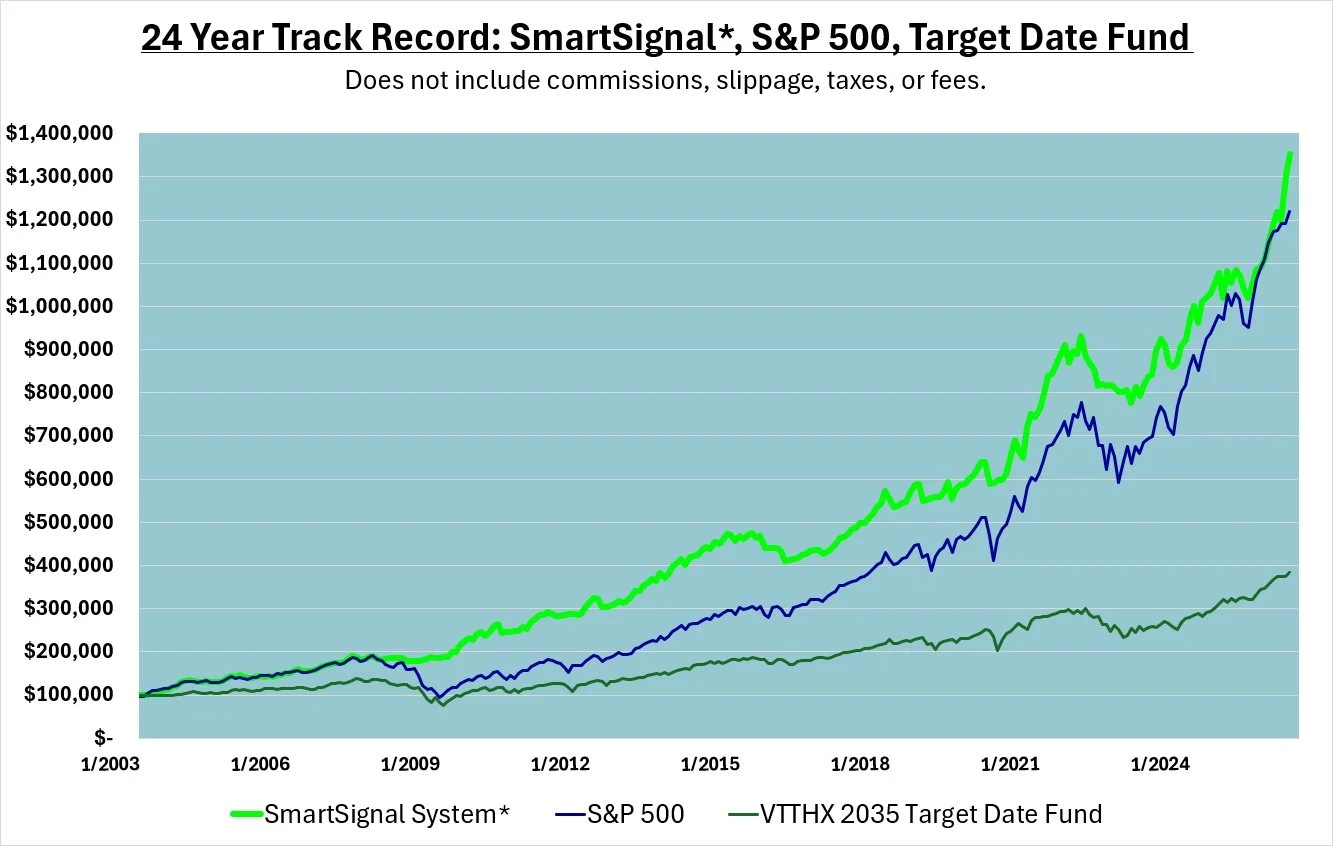
Now compare Easterling’s chart with the SmartSignal performance chart –
*SmartSignal Results are hypothetical as a combination of backtested data and live data. Past performance is not a guarantee of future results. See full disclaimers at www.gginvestor.com.
Notice anything similar? In both charts, the systematic approach mutes the market drawdowns, pulls away after the bad years, and generally keeps up during the good ones. Capital preserved through 2008, March 2020, and the 2022 drawdown remained available to compound in each recovery. That dynamic, repeated across three cycles, generates a steadier journey. Meanwhile, sailors spent years just getting back to breakeven after those drops.
How To Get Our Portfolio Rowing?
That’s the question most investors ask after reading Easterling’s works. SmartSignal followers already have a set of working answers – rules-based signals, monthly rebalancing, emotionally neutral execution, all in about 10 minutes a month. That discipline, compounded across three decades, can build an equity curve like the one above*.
Bill (my collaborator and coauthor) and I have spent the past year writing a practical guidebook to this approach. Our book will help readers build investment systems that row. We wrote the book for investors who need something better than buy-and-hold but who want to avoid becoming full-time traders.
The book arrives soon, with details to follow.
Keep rowing.
+++++++++++++++++
Want more guidance like this? The Growth Guardian Investor newsletter is free and built for self-directed investors approaching retirement.
Important Disclosures
Past performance does not guarantee future results. Investing involves risk including the possible loss of principal.
The performance shown combines two different kinds of data. Results from January 2003 through December 2024 reflect backtested application of the SmartSignal methodology to historical price data. Results after January 2025 reflect actual signals delivered to subscribers during that period.
Backtested performance has inherent limitations. It does not represent actual trading. Backtested results benefit from hindsight and do not reflect the impact of trading costs, execution slippage, market liquidity, or the psychological pressures of investing real money during live conditions. For these reasons, backtested performance may differ materially from actual results. Individual subscriber results may also vary based on execution timing, account composition, and other factors.
TenHundred Co., its officers, employees, and partners may hold positions in the ETFs or securities referenced by the SmartSignal methodology, and may trade those positions without notice. TenHundred Co. reserves the right to modify or discontinue the methodology at any time, and past performance data may not reflect the current methodology.
Growth Guardian Investor publishes systematic investing education and methodology training under the publisher's exclusion to the Investment Advisers Act of 1940. We do not provide personalized investment advice. Subscribers make their own investment decisions.
Full Disclaimers Statement on www.gginvestor.com.