Strong Economy = Rising Stocks? The Data Says Otherwise
Tuesday morning, I read an analyst report: the U.S. economy ran "red-hot" in Q3. Consumer spending surged despite supposedly sour sentiment. GDP growth? 4.3%.
So that means the stock market should keep climbing in 2026!
Right?
Well actually... decades of research tell a quieter, less intuitive story.
When researchers compare real economic growth to stock market returns, they find almost no relationship. Strong GDP growth doesn't reliably lead to higher stock prices. Weak growth doesn't necessarily hurt returns.
That surprises most investors - especially those who rely on headlines to guide decisions.
Here's what the evidence shows.
What Data Shows
Let’s picture a simple test: Take decades of economic data and stock market performance. Line them up side by side. See if growth predicts returns.
Many researchers have run this comparison across long time periods, multiple market cycles, and different countries. The results stay consistent: the correlation between real economic growth and stock market returns sits somewhere between very weak and essentially zero.
We’ll look at what Crestmont Research discovered when they compared economic growth (blue bars) to stock market returns (orange bars) by decade:
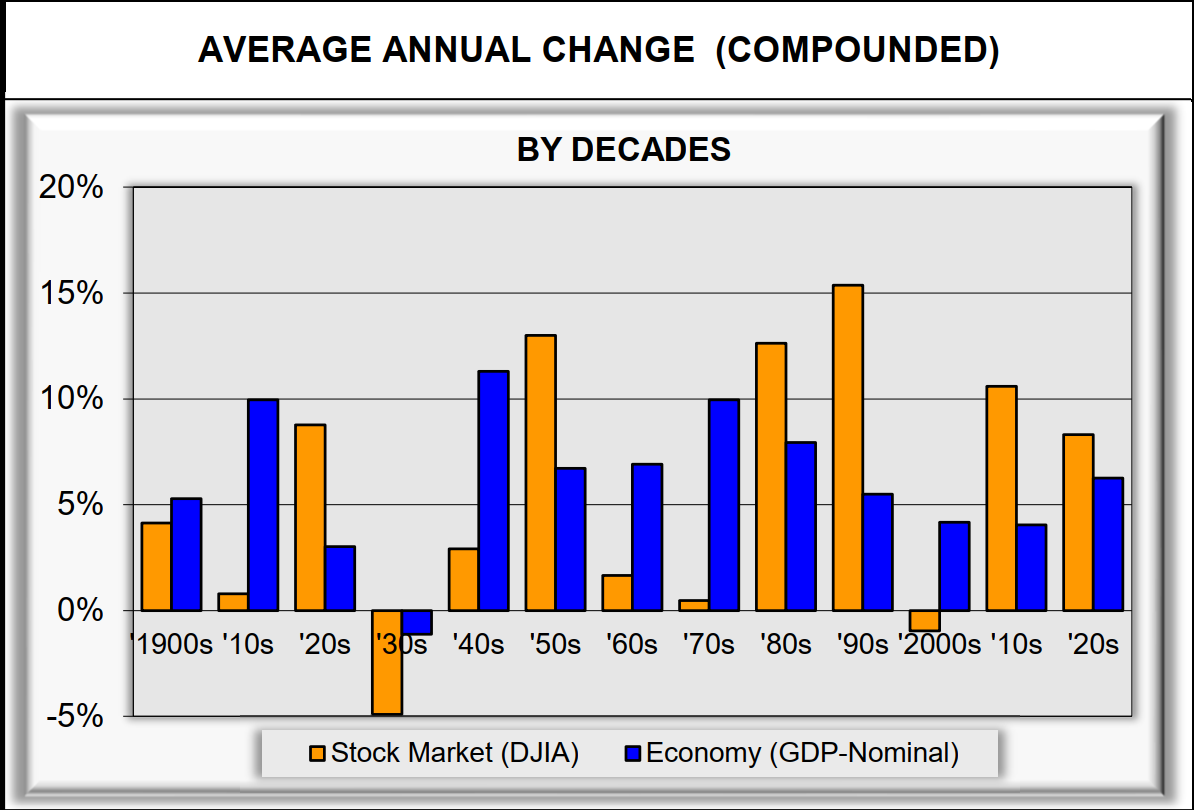
Notice the lack of pattern. Orange bars (stock returns) don't match blue bars (GDP growth).
• The 1930s? Horrible economic contraction, yet stocks averaged only a small loss.
• The 1950s? Strong 13% stock returns despite just 6% GDP growth.
• The 1970s? Spectacular 10% GDP growth but stock returns barely broke even.
• The 2000s? Positive economic growth but negative stock returns.
The bars don't match up at all. That's the counterintuitive insight from the data. Economic growth explains how fast the economy expands. It doesn't explain how much investors earn from stocks.
Why? Markets don't price today's economy: they price expectations about tomorrow. By the time strong growth shows up in official data, investors already baked that optimism into stock prices some time back.
What Actually Drives Returns
Crestmont Research asked a smarter question: If GDP growth doesn't predict long-term returns, what does?
The answer came back clear: the valuation (PE ratio) for stocks at the beginning of the investment.
Real economic growth has remained relatively stable over the last century or so. On the other hand, stock market returns vary wildly - from deeply negative to spectacularly positive. GDP growth fails to explain those huge variations. Actually, they come from the varying price investors are willing to pay for future cash flows.
Here's the relationship that matters:
Higher starting PEs → Lower future returns
Lower starting PEs → Higher future returns
Growth determines how large the economic pie becomes. PEs determine how much of that pie investors actually keep.
Now, PE levels don't offer precise timing signals. Valuations can't tell you what happens next month, next quarter, or even next year. But they do frame the range of likely outcomes over 10-year horizons. They also define the level of risk investors accept right now.
For investors within 10-15 years of retirement, the starting valuation frame matters more than any average returns record for any stock market investment.
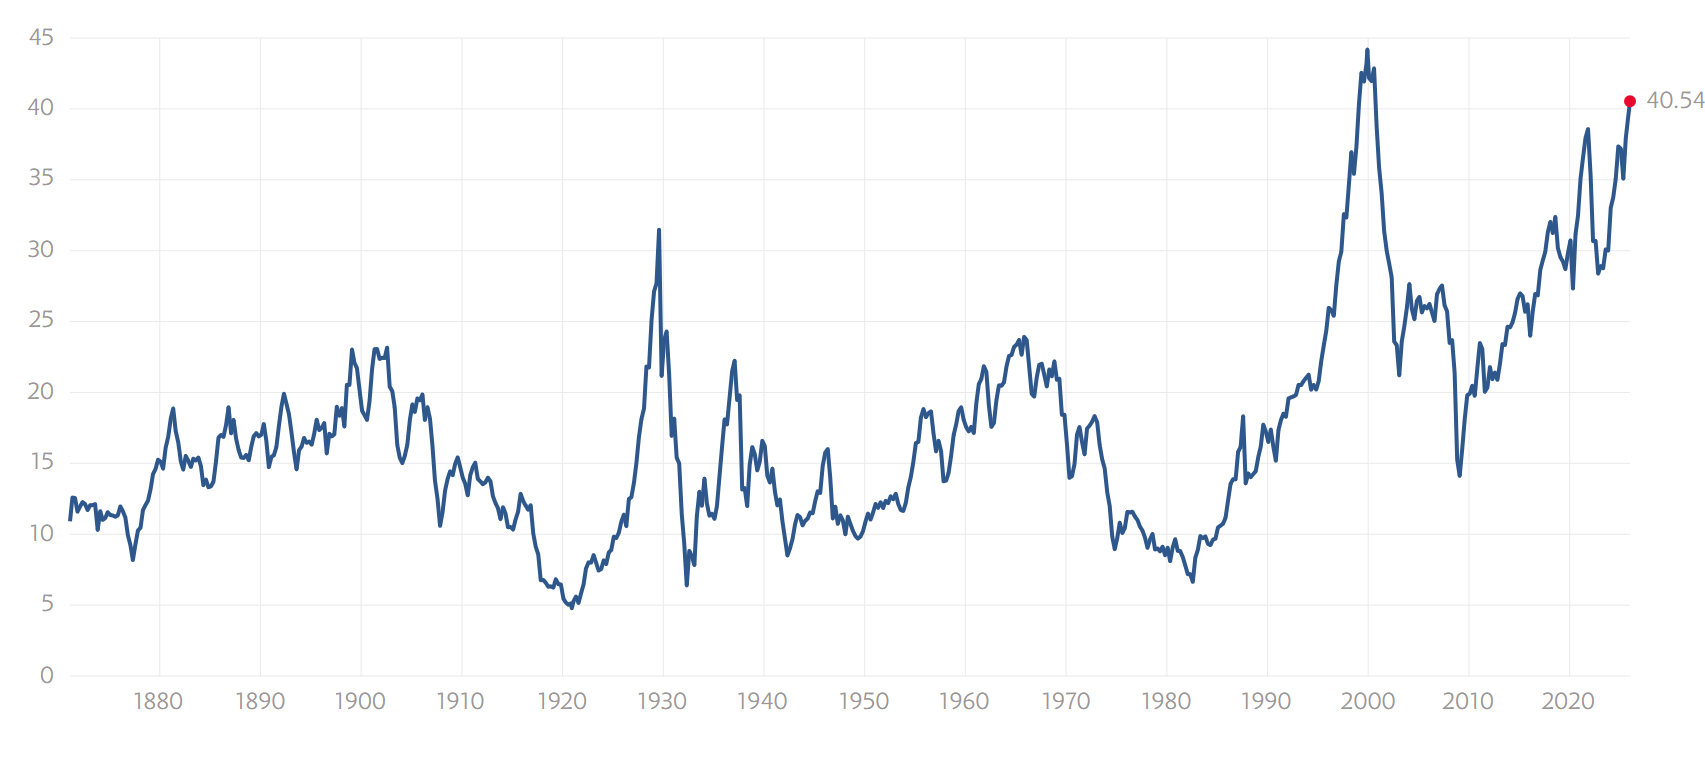
So - where are we today? The chart below shows the Shiller PE ratio at 40.54 - the second-highest valuation level in modern stock market history. Only the 2000 tech bubble peak exceeded this level. Look at the pattern: decades following the highest valuation peaks delivered very low stock returns.
Why the Growth Myth Persists
If GDP growth doesn't drive returns, why does nearly everyone believe it does?
Several forces keep the belief alive:
• Corporate earnings do connect to economic activity, but only loosely. When the economy expands, companies often earn more. That connection leads investors to assume stock prices should follow. Sometimes they do. Often they don't. Sometimes prices have already moved ahead of earnings. Sometimes they lag years behind.
• Media coverage reinforces the pattern. Headlines focus on current conditions. Markets focus on future expectations. That mismatch causes investors to act late - usually after optimism or pessimism has already shown up in prices.
• Growth feels comfortable. It tells a story of progress and momentum. Valuation feels abstract and inconvenient. One sounds hopeful. The other sounds cautionary.
Stories win attention. Numbers decide outcomes.
What This Means Near Retirement
Earlier in life, investors can ride through long drawdowns and wait for recoveries. Time works in your favor. A 50% loss followed by a full recovery eight years later? Painful, but survivable when you're 35.
Near retirement, large losses carry different consequences. This so-called sequence-of-returns risk stops being theoretical and becomes intensely practical. Losing 40% of your portfolio at 58 means either working longer, spending less in retirement, or maybe both.
Growth narratives encourage investors to stay fully exposed during periods when high valuations already reflect widespread optimism. When markets stumble from those levels - and history shows they do - recovery takes longer and the damage compounds.
Look at the pattern most recently:
• The 2000-2002 decline took the S&P 500 down 49% and required seven years to recover.
• The 2007-2009 drop fell 57% and needed until 2013 to break even.
Those weren't apocalyptic scenarios. They were standard bear markets following 2 of the 3 highest market valuations at the time.
The economy kept growing through both recoveries. Economic growth wasn't the problem. Starting from expensive prices was.
Valuation awareness doesn't require you to predict market turns or time moves perfectly. It requires respect for current conditions and understanding historical patterns.
Investors who focus on risk management and valuation regimes gain more control over outcomes than those who rely on economic stories - no matter how compelling those stories sound.
A Calmer Framework
Economic growth does matter. It just matters differently than most investors assume.
Growth supports business activity and shapes the environment where companies operate. Valuation integrates earnings and prices into a single relationship. Higher prices with stagnant earnings depress long-term returns. Modest prices with growing earnings expand them.
Growth conditions and valuation levels together define risk - not either one alone.
Systems that adapt exposure based on those conditions offer a steadier path than static beliefs about growth and patience. They reduce dependence on narratives. They increase reliance on evidence.
That approach doesn't require constant trading or dramatic portfolio moves. It requires clear thinking about where you stand now, what history teaches about similar conditions, and what actually threatens your specific plan.
Prepared investors stop asking whether the economy looks strong. They start asking whether current risk and valuation levels align with their goals and time horizon.
That shift replaces comfort with clarity - and clarity tends to age remarkably well.
Here's to entering 2026 prepared, not worried. Happy New Year!
+++++++++++++++++
Important Disclosures
Past performance does not guarantee future results. Investing involves risk including the possible loss of principal.
The performance shown combines two different kinds of data. Results from January 2003 through December 2024 reflect backtested application of the SmartSignal methodology to historical price data. Results after January 2025 reflect actual signals delivered to subscribers during that period.
Backtested performance has inherent limitations. It does not represent actual trading. Backtested results benefit from hindsight and do not reflect the impact of trading costs, execution slippage, market liquidity, or the psychological pressures of investing real money during live conditions. For these reasons, backtested performance may differ materially from actual results. Individual subscriber results may also vary based on execution timing, account composition, and other factors.
TenHundred Co., its officers, employees, and partners may hold positions in the ETFs or securities referenced by the SmartSignal methodology, and may trade those positions without notice. TenHundred Co. reserves the right to modify or discontinue the methodology at any time, and past performance data may not reflect the current methodology.
Growth Guardian Investor publishes systematic investing education and methodology training under the publisher's exclusion to the Investment Advisers Act of 1940. We do not provide personalized investment advice. Subscribers make their own investment decisions.
Full Disclaimers Statement on www.gginvestor.com.