SmartSignal System Report - July 2025
Welcome to the July 2025 performance update for our SmartSignal investment system. This month brought solid returns while maintaining our core principle of capital preservation during volatile market conditions.
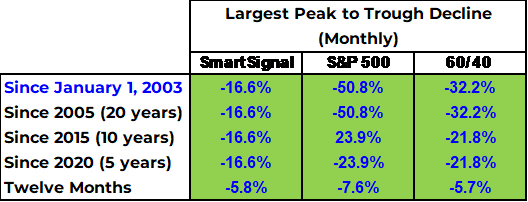
System Performance Results*
The SmartSignal System delivered steady performance* across multiple timeframes this July. Our fifteen-year return reached 10.4%, while the five-year return climbed to 11.1%. The twelve-month performance stands at 5.9%, with year-to-date results showing 3.5% gains. July specifically generated a 0.6% positive return, which compounds to approximately 7% when projected across twelve months.

These numbers reflect decent performance*, but I want to emphasize one of our system's primary objectives: keeping drawdowns minimal. During the market turbulence of late March and early April, our system experienced only single-digit losses while the S&P 500 endured a brutal 21% drawdown. This drawdown protection demonstrates exactly why we built this system - to participate in market gains while avoiding the devastating losses that can destroy wealth over time.
We have more drawdown analysis in the works and I can share preliminary results –
Regarding gold integration into the system, I mentioned this possibility two to three months ago, and our preliminary analysis shows promising results. I expect to provide definitive guidance by late August or September. This addition hasn't felt urgent for two reasons: summer schedules and gold's recent sideways movement wouldn't have triggered system selection anyway.
Looking at a relative performance chart of the S&P, foreign equities, and gold, you can see how gold (blue line) performed beautifully from last summer until the significant drop in early April. Since then, it has moved sideways while both the S&P and foreign equities climbed higher. From a technical analysis perspective, this flat pattern without major drops over several months often indicates accumulation. When investors accumulate positions slowly and steadily “under the radar”, they prevent prices from falling as they naturally would without any buying support. This accumulation phase frequently precedes upward moves.

We'll likely complete the research analysis and add a gold to our system in the coming two months. If gold starts rising in August while stocks start declining, we may see our system initiate a gold investment position as soon as September or October. Regardless, we'll follow our systematic rules and let the data guide our decisions.
Current Market Conditions
The twenty-year logarithmic chart of the S&P 500 shows we're currently trading in record territory, well above the 200-day moving average. The most recent all-time high occurred on July 28th at 6,389. Since then, employment report data created some weakness, though nothing dramatic has materialized yet. This weakness could intensify or dissipate—we'll monitor developments closely.
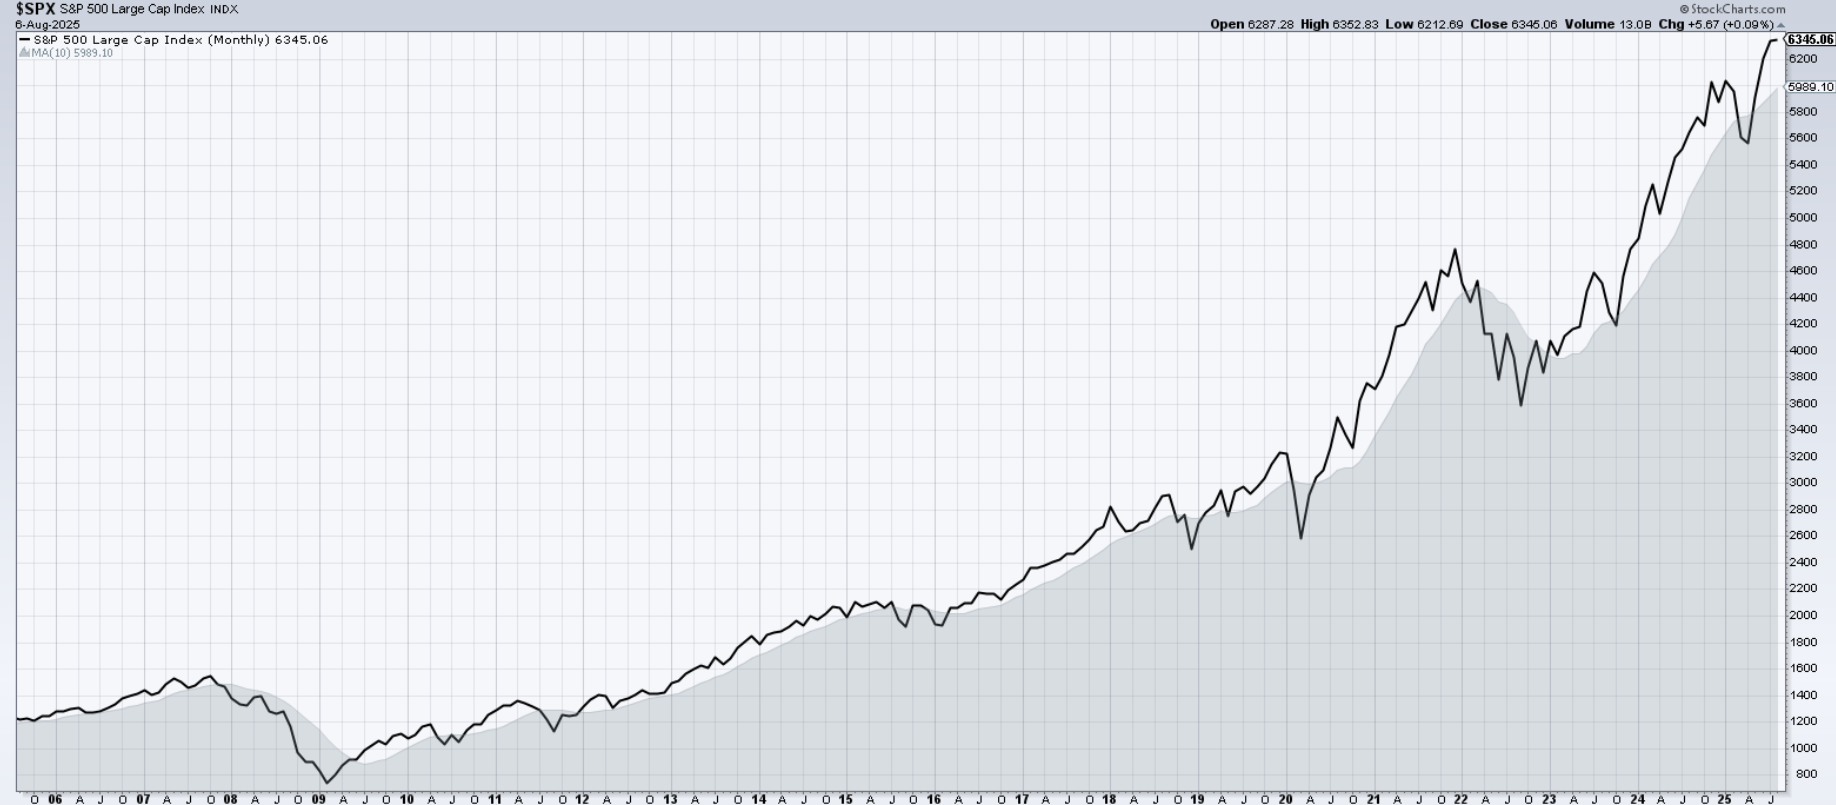
One indicator we've tracked for several months provides useful market insight. We examined this same indicator at the end of April and have continued monitoring it since. The caution zone for the percentage of stocks trading above their 200-day moving average extends up to about 54-55%. This indicator strengthened recently, appearing ready to exit the caution zone in July before dropping back at month's end.

Source: https://www.barchart.com
Multiple indicators can help investors understand market positioning, strength, and potential short-term direction. Several of these currently flash warning signals in caution zones. Does this mean an imminent downturn approaches? Possibly not—not every indicator shows caution, and not everything signals warnings simultaneously. The market might dip this month, or it might continue higher. Either way, the SmartSignal System will provide guidance.
The Big Picture: Historical Context and Future Implications
This month, I want to highlight two particularly striking comments from John Hussman's July market analysis. First: "Overall then, the stock market stands at the highest level of valuations in US history, easily eclipsing the extremes of 1929 and 2000." This echoes Jeremy Grantham's similar observations from last month. Second: "The likely return investors can expect for taking risk both in stocks and low grade bonds stands at the lowest level in history."
Hussman earned his PhD in economics from Stanford and has managed funds professionally throughout his career. His economic-oriented analytical approach provides valuable insights through detailed research. One particular chart from his July letter illustrates his second point about expected returns.
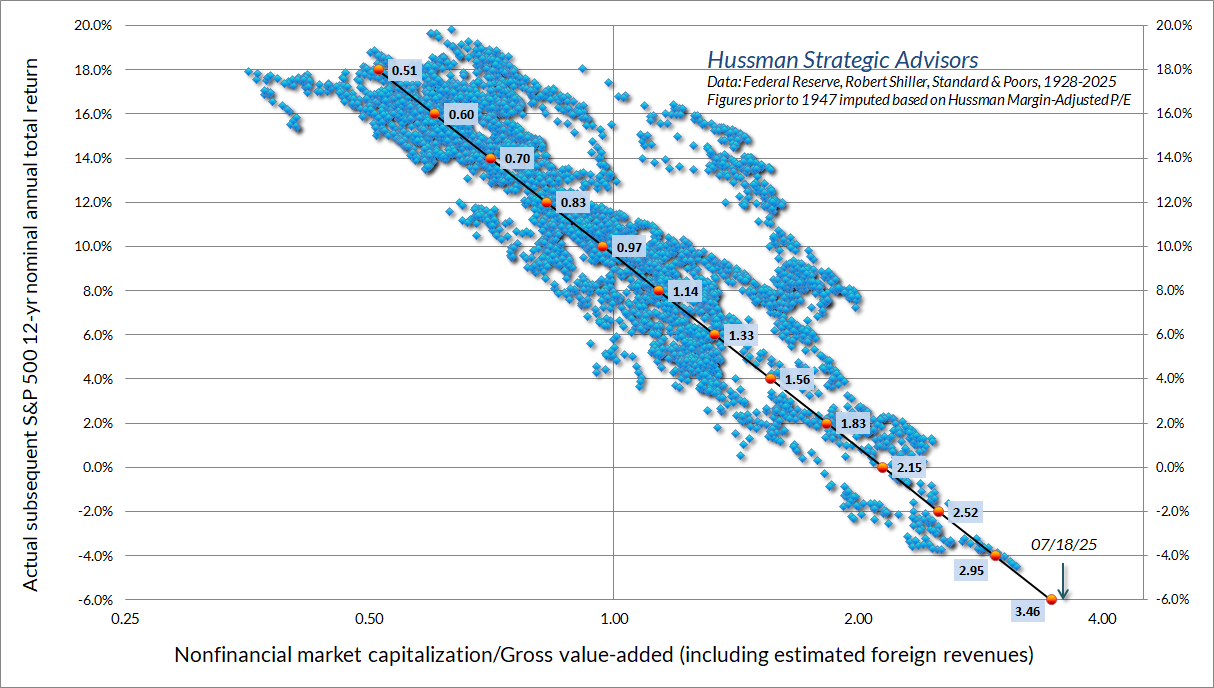
Since 1928, this chart shows the relationship between twelve-year S&P annual total returns and the non-financial market cap to gross value-added ratio. In simpler terms, it examines the price-to-value-added ratio for non-financial companies. As this multiple increases, S&P returns over the following twelve years tend to decrease. This makes intuitive sense: at bull market peaks, price-to-value ratios reach extremes, while bear market bottoms show very low ratios.
Markets typically move in five-to-twenty-year cycles, and this relationship shows strong correlation with a clear regression line. The current situation appears as an outlier in the bottom right corner—no other data point comes close to our current position. You don't need a PhD in economics or deep understanding of statistical analysis to recognize we sit firmly in unprecedented territory.
I encourage readers to visit husstmanfunds.com and read his complete commentary. While some information proves complex, much of his analysis remains accessible and fascinating. He provides approximately a dozen additional charts supporting his conclusions about current market positioning.
A different dataset reaches similar conclusions through alternative analysis. This relationship, developed by Ed Easterling, examines the connection between price-earnings ratios and subsequent ten-year returns. The gold line represents the Shiller CAPE PE ratio dating back to 1909, while green bars show annualized ten-year returns.

Source: www.crestmontresearch.com
This model suggests we face at least declining, if not negative, returns over the coming decade. Notice how the declining gold line corresponds with rising green bars, while the rising gold line correlates with falling returns. As PE ratios increase, following ten-year market returns tend to decrease. Currently, we sit at approximately 37-38 on the PE ratio, and this relationship suggests challenging times ahead for consistent stock market gains in the next five to ten years.
Easterling identifies inflation as the primary driver of price-earnings ratios. A related chart highlights the potential for additional inflation in the coming months. The Consumer Price Index and the ISM Services Prices Paid Index maintain a close correlation. While current inflation runs around 2-3%, the services pricing index suggests higher inflation likely approaches in the near to intermediate term.
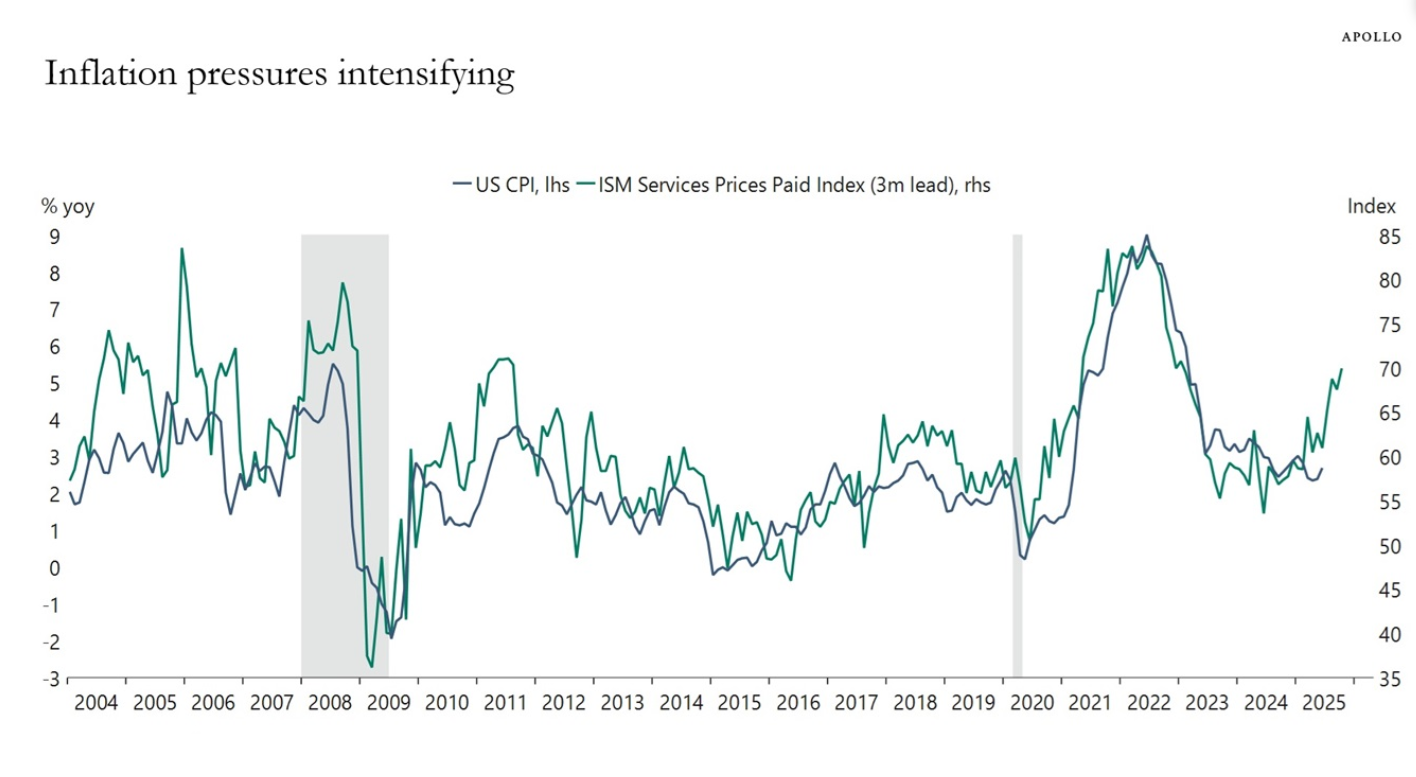
Stock markets tend to rise (a bull market) when the inflation rate is low (2-3%) and stable. When inflation rises, especially unstably, companies struggle to maintain healthy profits with rising input costs. The chart suggests that we may be moving towards this unfavorable condition.
On a longer term basis, consider a scenario involving rising inflation or even stagflation, where growth stagnates while inflation accelerates. We experienced this before during the 1970s. From 1965 through 1981, the stock market moved sideways with tremendous volatility for approximately fifteen years. On a nominal basis – just looking at the index, it ended near where it started. If you adjust the index numbers over time for the effects of inflation, however, the dollar value of the “same index number” in 1981 was actually far less in real terms.

Source: www.crestmontresearch.com
The possibility of this scenario replaying in the late 2020s and early 2030s represents another reason we're considering adding gold to our system. Gold typically performs well during inflationary environments, potentially providing excellent portfolio protection and positive real returns (inflation adjusted) if we enter similar economic conditions.
Will we experience a 1970s-style market over the next decade? We don't know. Given current conditions, such an outcome wouldn't surprise someone paying attention. Could this market continue significantly higher? Probably not - but it might. We are in uncharted territory though that doesn't prevent further advancement.
Preparing for Uncertainty
My intent in sharing these big-picture views isn’t to scare anyone. It’s to help you stay aware of where we are in the context of economic and market history – and to prepare for what might be coming.
Here in North Carolina, we're coming up on peak hurricane season. Are people scared? Not really. When we hear about a storm heading our way, what do we do? We prepare. We get supplies, review our evacuation plans, and get ready for whatever strength storm might hit. That's exactly how we need to think about the current market.
Right now, two groups of investors concern me as unprepared:
The “buy-the-dip” veterans — Recent years have rewarded anyone who bought after a decline. But at some point in the future, a dip could (will) turn into a prolonged slide. Those conditioned to expect quick rebounds may try to exit in the second leg down but that will only add to selling pressure.
The blissful buy-and-hold crowd — Buy-and-hold works over very long horizons. If you have 25–35 years before you’ll need money from your stock market investments, history confirms the market will recover and even gain. But if your horizon is under 20 years — especially under 10 — history also confirms that you could face significant losses if you need to take money out of stock market investments.
Why We Created the SmartSignal System
The SmartSignal System adapts to market conditions with minimal effort on your part. It holds just one or two positions at a time and requires only a few minutes of your attention one time each month. That leaves you free to focus on your life, sleep well, and look toward a financially secure retirement.
It’s not magic and it’s not risk-free — no investment approach is. But by following clear rules and keeping losses smaller during down markets, it seeks to stack the odds in your favor over time.
If you have friends or family who might benefit from learning this investment methodology, please share my information with them or provide their details to me. I'd welcome the opportunity to discuss these concepts with them.
I look forward to talking with you next month. Until then, take care.
RJ
*Important Disclaimer: The information contained in this email is for educational purposes only. I am not a registered investment advisor, broker, or dealer, and I am not licensed to provide personalized investment advice. Nothing in this email should be construed as an offer, solicitation, or recommendation to buy or sell securities or any other financial instruments.
All investments involve risk, including the loss of principal. Please consult with a qualified financial advisor, tax professional, or legal counsel before making any investment decisions. The content of this email is not intended to replace professional advice tailored to your individual circumstances.
AI Transparency Statement - I create all of my content myself. I use AI tools only to help refine it by improving clarity, flow, and readability - never to produce it for me.