Smart Signal System Report - May 2025
System Update
The long-term system numbers continue to hold up well. Over the past 15 years, the SmartSignal system has a compounded 10.2% annual return and over five years, the rate is 11.8%.
Shorter-term results show a more challenging picture. The one-year return sits at 3.6%. That still counts as a gain, but comes in on the lower side. Year-to-date, the system shows a slight loss of -0.8%. On a one-month basis, the system rose 2.5% in May. That sounds encouraging, but real encouragement comes when we look at a comparison of downside figures from the last few months.
From February through early April, the S&P 500 dropped 21% peak to trough (Feb 18 to Apr 8). That decline stirred up a lot of emotion in the news and across the markets. Meanwhile, our system missed most of that drop as it declined only 9% from peak to trough. That’s a big deal if a collapsing account keeps you up at night. At times like these, minimizing drawdowns can make produce peace in the short run and in the long run producing superior returns.
The chart below comes from the brokerage for the live system account. The blue line represents the S&P percent gain/loss from the start of the year and the red/green line shows the SmartSignal System live account balance. While the S&P does not represent the performance benchmark for the system, it does show how the shift in the system’s positions protected the account value vs anyone who simply uses buy and hold. The system’s investment shifts would have protected the account against the possibility of an even larger decline had they developed in April. If (when) such a bigger decline comes in the future, the system will be ready.

Source: Interactive Brokers
Market Update
For this part, let’s zoom out a little.
Let’s look at a monthly line chart of the S&P 500 where you can see the dip in the upper right corner. That’s the February to April slide. Seems like nothing too dramatic – unless you watched any news recently or just lived through it. The decline generated panic for some people. That’s one of the reasons why I like using a monthly line chart: it helps strip out the noise - and the emotion. For comparison, the 2022 decline was deeper (>30%) and longer as was the global financial crisis where the market dropped more than 50%.
The gray area under the black price line represents the 200 day or 10 month moving average. More on that next.

The 200-day (about 10 months) moving average indicator averages the price for the last 200 days. If the recent moving average line points up and today’s price is above it, then the trend has a likelihood of continuing – at least for the near term. If price falls below a rising moving average (as happened in April), that may indicate the uptrend may end. For now, the moving average continues upward and the price regained the position above it. Short term, the trend appears to remain up.
Remember, however, that the S&P has only the 500 biggest and most successful companies in the market. What about the other 1,700 or so companies on the NYSE?
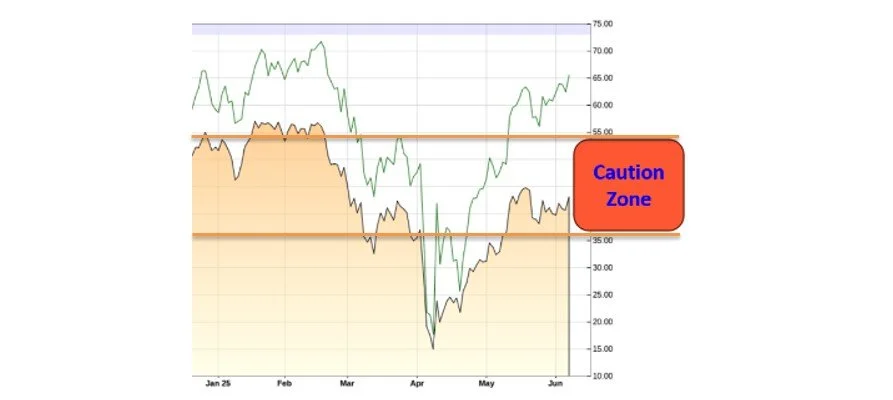
Are they above their 200 day moving average? If so, that would indicate a healthy market overall. Let’s look at the chart below to find out. The shaded bottom area of the chart shows the percentage of stocks on the NYSE that are above their 200 day moving average
Right now, less than 45% of the stocks on the NYSE trade above their average price for the last 200 days. That tells us most stocks haven’t fully recovered.
When fewer than 50% of stocks above their 200-day averages, that places the market in the “caution zone.” If that number improves while the S&P continues rising, we could move into healthier territory. But if the S&P keeps climbing while the percentage flattens - or worse, declines, that divergence may signal further near-term weakness for the market.
In one sense, we don’t care. Our system doesn’t rely on guesswork, it reacts to what the market does. We monitor indicators but we let the system rules make the decisions. That keeps us grounded in a proven methodology, especially when markets send mixed signals.
Big Picture
Now, let’s widen the lens and talk about some bigger themes, especially around debt and interest rates. Maybe I should start calling this section “Debt Watch.” The level of US debt has started concerning many big names in the financial markets to the point they are talking about the subject openly.
Moody’s recently downgraded U.S. government debt from AAA to AA. Shortly afterward, Jamie Dimon, CEO of JPMorgan, warned that a “crack” could appear in the bond market. He didn’t define that word, but it lines up with comments Stan Druckenmiller made earlier this year. Druckenmiller said he could imagine a failed Treasury auction kicking off a financial crisis. Both men used a similar timeline - six months to six years – a window that spans the end of this year through 2031.
Interestingly, Dimon went on to say that JPMorgan would be fine should a bond market crack appear. In fact, he expects they would profit. But what about individual investors like us? What can we do?
Druckenmiller said that he had already exited fixed income entirely for the foreseeable future. That speaks volumes and you might follow his lead. If you hold long-term bonds—especially Treasury bonds that mature in 20+ years, and you still want to hold some bonds, consider shifting to shorter-term maturities (1-3 years). This reduces your risk to a drop in bond prices if a crack forms. Very short-term Treasury Inflation-Protected Securities (TIPS) could offer a good alternative.
Another option: look at stock market sectors that tend to benefit from higher rates. Financials and utilities often do well in rising rate environments – and are already doing well now. Over the past year, the financial sector ETF (XLF, the blue line below) has risen more than 20%. Also, utilities (XLU, the green line below) are up close to that. If a bond market shake-up happens, these two sectors could do quite well or they might do just OK – but “just OK” will probably be a lot better outcome than a bond market with a crack.

One more voice worth noting: NYU professor Nouriel Roubini, famous for predicting the 2008 crisis, shared four forecasts last month. He expects a mild recession in 2025, driven partly by the current uncertainty around trade and tariffs. He also sees an AI investment boom which many already sense. He noted the bond market seems to act as a guardrail for the administration. We saw that in April when Trump paused the tariff rhetoric after bond rates spiked.

Roubini suggested one more move: sell treasuries and buy gold.
Gold has performed well this year.

Source: www.goldprice.org
Bill—my collaborator at Applied Finance Research—and I recently realized that both of us have benefited from gold investments in 2025. We’ve had several conversations about investing in gold because it fits in now with Ray Dalio’s country cycle concepts and Ed Easterling’s market cycles. Interestingly, it also fits most of the SmartSignal System’s criteria for inclusion in the system: long-term trends, strong performance, and low correlation with equities.
We’re actively researching how gold would have affected the system’s performance if it had included it in the past. We are also researching whether to include gold in the future. The main question is access: can people buy a gold ETF in their retirement plans? If you have an IRA at a brokerage, this should pose no problem. If you have money in a more restrictive plan, however, like a 401(k) or 403(b), you may lack a gold or precious metals option. I’ll be reaching out to learn more about your account structures in the coming weeks.
Closing
Thank you for your business!
If you have friends or family who might benefit from a system that mostly sidestepped a 20% market drop, feel free to send my information their way, or send me their info and I’ll follow up.
As always, if you have questions, reply to this email or text/ call if you have my number. I’d love to hear from you.
Take care,