SmartSignal System Report - April 2025
SmartSignal System Performance
Here's how the system performed at the end of April.
Starting from the bottom, the table below shows the one-month loss of 2.1%. Year-to-date, the system has declined 3.4%, but our 12-month return remains positive at 5.5%. The 5-year and 15-year returns align more closely with that 10% goal that we set the system up to capture.

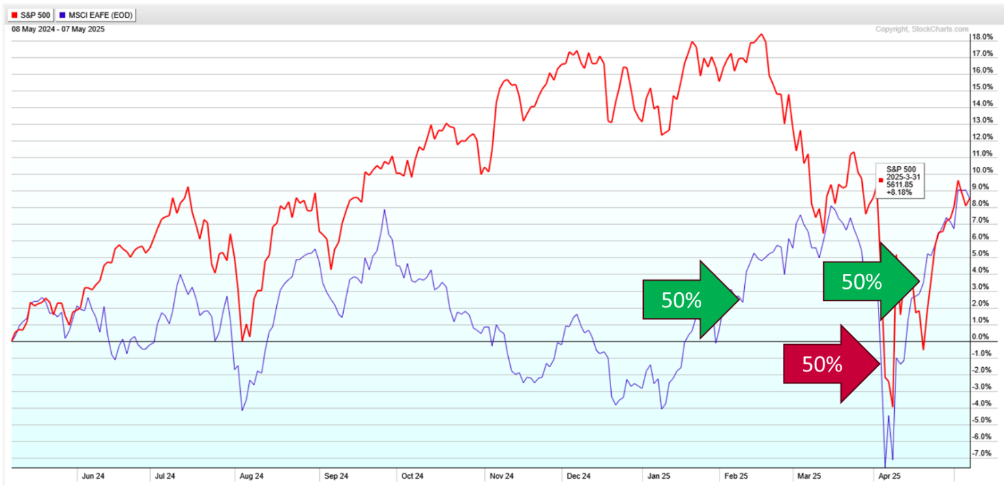
The system exited 50% of the investment in US stocks at the end of February and switched over to foreign equities. Then at the end of March, the system exited US stocks completely and moved to cash. This move spared us from a good bit of the volatility that characterized April's market.
Foreign equities still had a volatile month. The system entered foreign equities at the end of January and rode the upward trend. In early April, however, a high volatility situation triggered an exit of foreign equities. Once volatility subsided and the trend resumed, the system gave a re-entry signal, a repurchase in late April
You might wonder why the system exited near the bottom before coming back up. This looks obvious and - in hindsight, the exit/re-entry steps may even seem confusing.
Let’s consider the situation back in early April - around the 4th. Both the S&P 500 and foreign equities were diving.
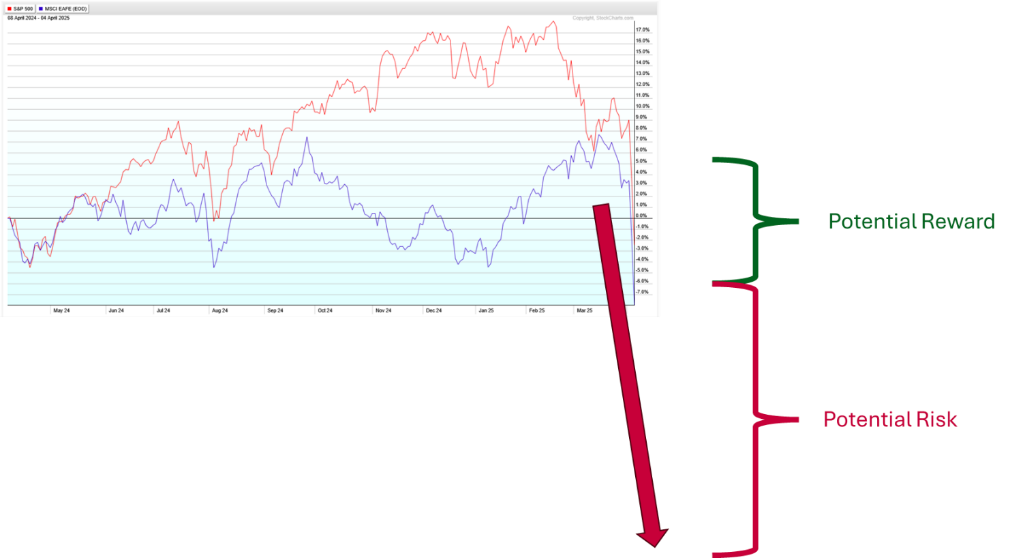
The best case scenario would have been a recovery of prices back to the market's previous high - a modest potential reward. The potential risk at that time, however, was quite large.
You can compare this situation to living near a river during a flood.
Consider living beside a river that has reached its average flood height. Your house is more near the 100 year flood stage - a good ways above the average flood level. Now consider that it’s still raining. Might you think "On average, the river doesn’t flood much more than this level. The last 100 year flood was less than 100 years back so I’ll probably be OK."? Or would you contemplate the potential for a 100-year or even a 500-year flood event where the water rises far, far above average levels? With the river at the average flood level and the rain continuing, you probably want to weigh the reward of staying in the house vs the house being flooded – or worse.
The potential risk for maintaining an investment under early April conditions appeared substantial. Sometimes taking small risks for small rewards makes sense. Other times, taking large risks for large rewards works. The ideal scenario involves taking small risks for large rewards. But taking large risks for small rewards? That strategy eliminates takers - in markets and in life. So the system signaled an exit opting out of a small potential reward to protect against a big risk of a crash. Conditions were favorable for a re-entry later in the month.
Market Update
The long-term chart still points up and to the right despite the small recent decline.

Has this decline finished? We don't know. The S&P now sits within a few hundred points of its February all time high. It might head up to new highs in the coming weeks or months. It might stall and slosh around sideways for a while. Or it might hesitate near the previous high, roll over and head down for a larger decline than April’s.
What we do know: volatility has diminished. Look at the chart from March through early May. You’ll see two huge gaps in the middle along with very tall bars - that's volatility. Volatile days cluster and like a flood, run the risk of going far beyond expectations.
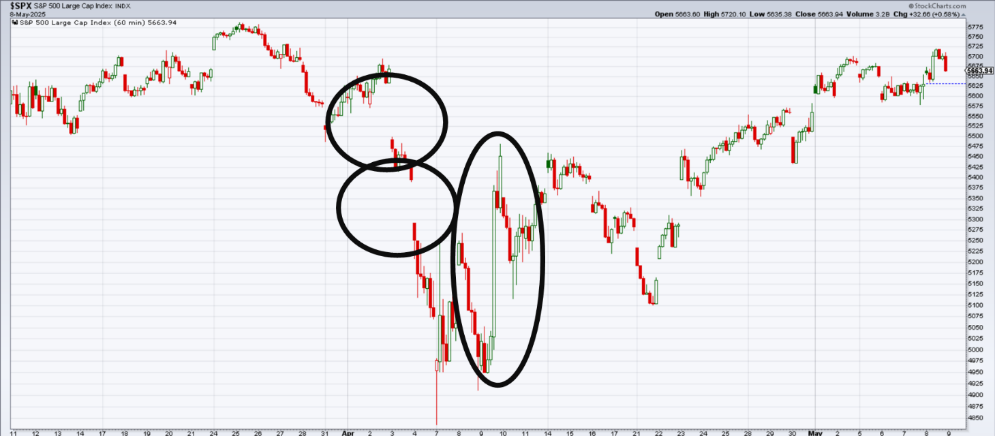
Volatility has subsided now. See a few gaps on the right side of the chart but nothing like the size on the left. The bars have grown smaller and more orderly, progressing upward and to the right.
We may receive a signal to reenter in the next month. We'll let the system guide us.
The Big Picture
Warren Buffett’s actions are often more instructive than what he says – though those tend to be pretty instructive as well

Right now, he holds almost $350 billion in cash. What does this mean? Buffett’s investing process sees risk in current conditions so Berkshire holds 30-40% cash. Buffett stated he anticipates opportunity ahead, but not in the near term. Why? The following matrix might help explain his big picture stance.
This matrix from Crestmont Research (available at crestmontresearch.com by Ed Easterling) shows compounded annual investment returns for the S&P 500 back to 1900. (Proxies were used before 1957 when Standard and Poors created the index.)

We’ll go into how to use this matrix in the future but just notice areas of red, green, pink, and blue. This doesn't represent randomness. Clear relationships exist among the years and the market follows definite sequences. The red areas mark periods of market losses over several years, while green areas show positive returns. Moving diagonally from the upper left to the lower right, note the alternation: red, green, red, green.
What do we see recently, at the lower right hand corner? Lots of green down in that corner – indicating positive returns in the stock market. What follows green? Red – which means flat or losing years in the stock market. Will this happen this year or next? Maybe. Maybe not. Predicting the starting point has less utility than adjusting to the long-term phase.
Green periods in the matrix typically indicate periods of rising price-earnings ratios (PE). The chart below confirms rising PEs for the last 10-15 years. After periods of climbing and high P/E ratios, what comes next? Declining PE ratios – and periods of red years in the matrix above. Can we pinpoint this to the current year or maybe next year? No, but it likely approaches soon.

The chart below through April updates the market P/E ratio to 34 - historically very high territory.
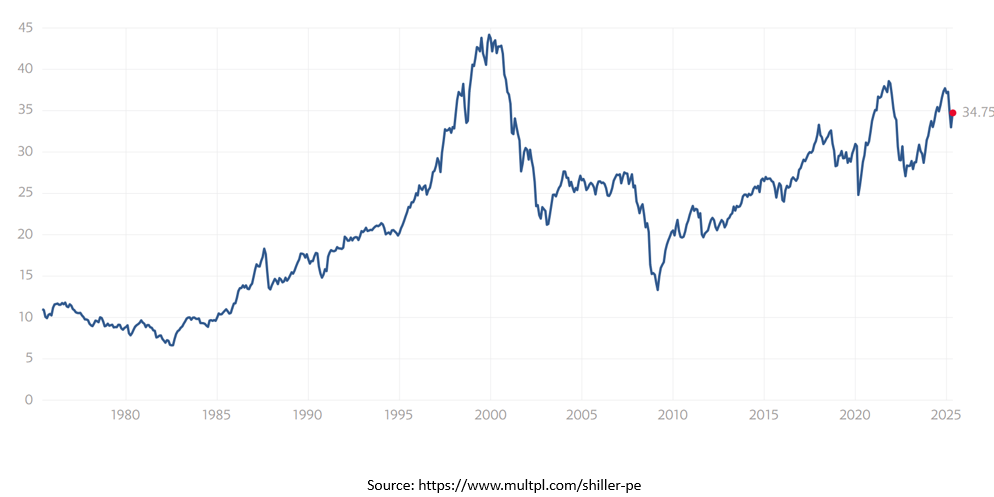
The market P/E has declined since the start of the year but will this continue? We'll see.
We don’t need to predict the market or guess what’s coming next. We just pay attention. The SmartSignal System watches the market’s behavior and adjusts accordingly, helping guide our next move with clarity.
Ed Easterling of Crestmont Research compares investing to sailing and rowing. In rising P/E environments - bull markets - you can just “sail” by holding index funds. But when P/E ratios decline, you have to “row” to make money in the market. Luckily, the SmartSignal System rows by design.
The real question isn’t what the market will do - it’s what we’ll do in response. We’ll follow the system. It listens to the market and adjusts dynamically.
Thank you for your business. If you know someone who lost sleep during recent market volatility or who lacks an investment plan, please pass along my name or share their contact information with me. Not for advice - just a conversation.
The next SmartSignal System signal email will come out next Friday, May 30.

RJ