Secular Volatility: Four Lenses on the Decade Ahead
When people talk about markets, they usually point to long stretches moving in one direction – like the secular bull market in the 1990s. We've also endured secular bear markets like the 2000s. What if the next ten years, however, deliver something different - secular volatility? Instead of a steady path up or down, picture a decade of sharp rallies, sudden drops, and sideways drift. That possibility deserves attention, especially if your retirement sits closer than it used to. Let's walk through four lenses that point toward this outcome, then consider what it means for us getting ready to retire.
Case One: The Historical Model
History rarely repeats perfectly, but it rhymes often enough to pay attention. In the 1960s and 70s, U.S. leaders leaned hard on the Federal Reserve to keep interest rates low, even as inflation pressures built underneath. Presidents Johnson and Nixon both pushed their Fed chairs to ease rates, wanting to stoke the economy more than worry about the potential for rising prices across the board. The result? Inflation simmered for years before exploding into double digits. Markets showed the end results - commodities skyrocketed while stocks ground through a lost decade of high volatility and negative returns after inflation.
Fast forward to today - ballooning deficits, a public frustrated with high borrowing costs, and mounting political pressure on Jerome Powell to cut rates. If the Fed eases too soon or too much, history suggests inflation could stick around longer than anyone expects. That's not a backdrop for steady stock gains; it's a setup for long-term volatile markets.
Case Two: The Generational Model – The Fourth Turning
Two historians, William Strauss and Neil Howe, mapped Anglo and American history into stages they called "turnings." Four stages make a cycle that lasts about 80 years and then repeats. Each cycle ends with a crisis phase - what they call the Fourth Turning. The last three crisis phase peaks? The culmination of the American Revolution in the 1780s, the Civil War in the 1860s, and World War II in the 1940s. By their framework, the current crisis began around 2008 and will likely climax sometime in the late 2020s or early 2030s.
Do we have any evidence today that we are in a late crisis stage? Unfortunately, yes. Look around. Polarization, great mistrust in institutions, rising global tensions – these all fit the pattern. Markets hate uncertainty and crisis climaxes deliver plenty of it. That usually translates into swings both ways: big rallies when optimism takes hold, sharp setbacks when fear returns, confusion in between. If the Fourth Turning thesis holds, we may spend the rest of this decade navigating a major storm before any real calm returns.
Case Three: The Nation-State Lifecycle
Ray Dalio's work on the rise and fall of empires gives us another warning light. Every great power eventually buckles under the same three pressures: heavy debt, deep internal division, and a rising challenger abroad. Britain lived through it in the early 1900s. The United States may face it now.
Record deficits pile higher each year, adding to an already huge national debt. Politics feels more fractured by the day. Meanwhile, China tests America's resolve across trade, technology, and geopolitics. History shows that when nations can't service their debts honestly, they resort to the printing press. Devaluation and inflation follow. Empires don't fade quietly and markets rarely glide upward during the turbulence of transition.
Case Four: The Total Returns Model
Ed Easterling at Crestmont Research determined that long-term returns boil down to two drivers: earnings growth and valuation - specifically, what investors will pay for those earnings. When investors pay steep prices for equities, as they do today, returns over the following decade tend to disappoint.
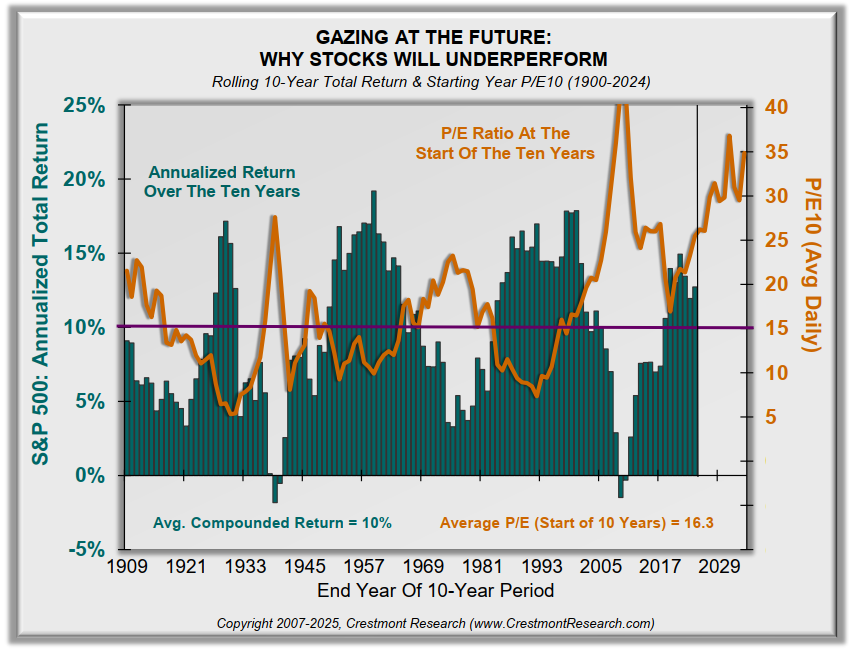
The market's biggest PE ratio peaks (see golden line above) - 1929, 1969, and 1999 - all set up long stretches of flat or negative real returns afterward. See the charts below -
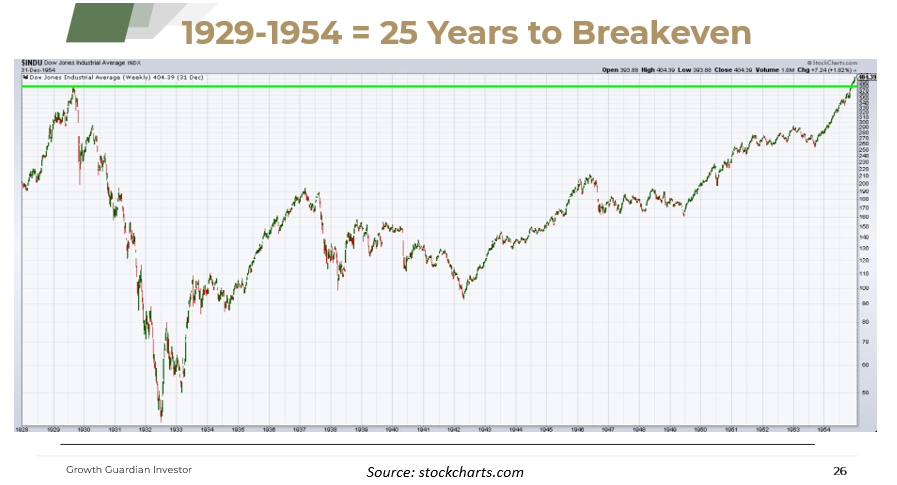
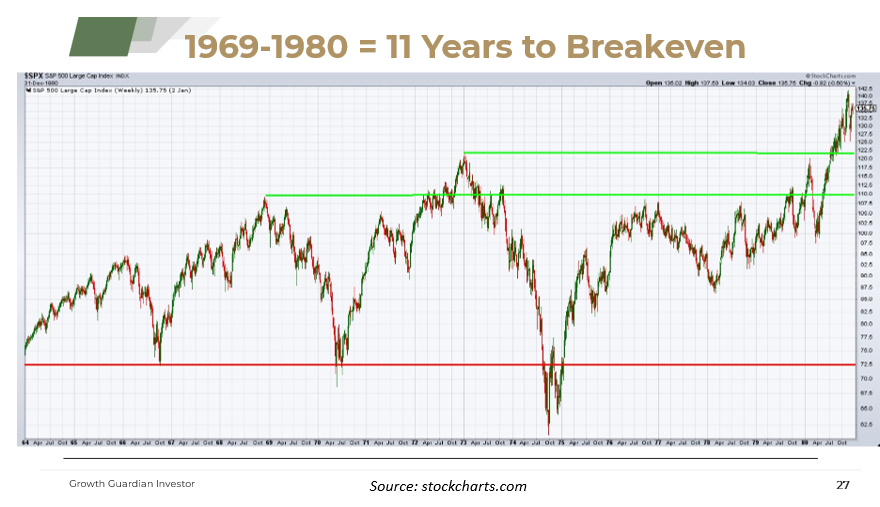
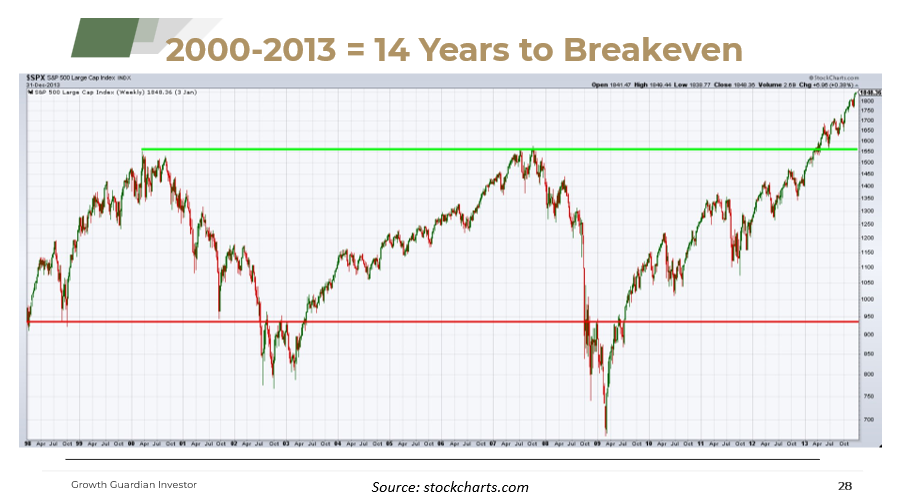
Right now, valuations sit near historic highs. The historical pattern would suggest another long phase of declining multiples could follow. This does not mean the market is likely to decline year after year for a whole decade. Look at the charts above. Even in the deflationary bear market of the 1930s, the market moved significantly in both directions. A secular period of declining PE ratios does mean, however, that passive investors may face a decade of frustration. Further, returns after inflation could actually be negative - even if prices seem to have recovered.
What This Means for You
So, what does all this mean? These four lenses point to the same message: the decade ahead may not reward passive buy-and-hold or target date fund strategies the way many people have come to expect. Instead, the coming years may favor investors who prepare, set rules in advance, and stay adaptable.
This also means the following prudent steps would help:
Diversifying your investments across strategies and asset classes. This way, you build resilience through broad strengths rather than hope for the best with fragility (weakness of concentration in a stressful environment).
Sizing positions carefully so that no single shock derails your plans.
Keeping some cash ready for opportunities. Cash feels so boring when markets are climbing, but it turns into a powerful tool when fear grips the crowd and stocks reach bargain price levels.
We can't predict the exact path ahead - nobody can. But when storm clouds gather on multiple horizons, it makes sense to prepare.
Using multiple, rules-based systems, not gut reactions, gives you the best shot at surviving volatility and still reaching your goals. That's how you protect what you've built and keep yourself in position to grow it when the skies eventually clear.
My primary goal for Growth Guardian Investor is to help investors protect what they’ve built while still growing for the future. That’s the reason I developed the SmartSignal System. If you’re curious whether it fits your goals, the fact sheet gives a clear picture.
+++++++++++++++++
Important Disclosures
Past performance does not guarantee future results. Investing involves risk including the possible loss of principal.
The performance shown combines two different kinds of data. Results from January 2003 through December 2024 reflect backtested application of the SmartSignal methodology to historical price data. Results after January 2025 reflect actual signals delivered to subscribers during that period.
Backtested performance has inherent limitations. It does not represent actual trading. Backtested results benefit from hindsight and do not reflect the impact of trading costs, execution slippage, market liquidity, or the psychological pressures of investing real money during live conditions. For these reasons, backtested performance may differ materially from actual results. Individual subscriber results may also vary based on execution timing, account composition, and other factors.
TenHundred Co., its officers, employees, and partners may hold positions in the ETFs or securities referenced by the SmartSignal methodology, and may trade those positions without notice. TenHundred Co. reserves the right to modify or discontinue the methodology at any time, and past performance data may not reflect the current methodology.
Growth Guardian Investor publishes systematic investing education and methodology training under the publisher's exclusion to the Investment Advisers Act of 1940. We do not provide personalized investment advice. Subscribers make their own investment decisions.
Full Disclaimers Statement on www.gginvestor.com.