SmartSignal System Report - September 2025
Welcome to the September report on the Smart Signal System performance, the market, and what we're watching in the big picture.
SmartSignal Performance
Here's where we stand heading into October:

September was a robust month for both the system and the broader market.
Gold Update
The system recently took a position in gold, largely because of the strong relative performance that we've seen just in the last six weeks or so. To be honest, I felt a little nervous about this buy signal. After a steep climb like we just had, pullbacks tend to happen. That's what I worried about with that signal.
With a systematic approach, however, following the rules makes sense. The system helps in situations where I might feel scared or excited. I don't know what gold will do next. Yes, it could roll over tomorrow or next week. It might keep climbing for a while longer. It could flatten out. It might do some combination. A lot of people have tried calling a top on precious metals rallies before and have failed spectacularly. These runs can go farther and longer than anybody imagines.
So rather than worry, I'm just going to follow the system knowing it has a better track record than my passing enthusiasms or worries.
Market Update
Looking at the 20-year chart with the 200-day moving average, you might imagine how someone could have held from the early 2000s straight through to today. The single biggest dip was back in 2007-2008, right?
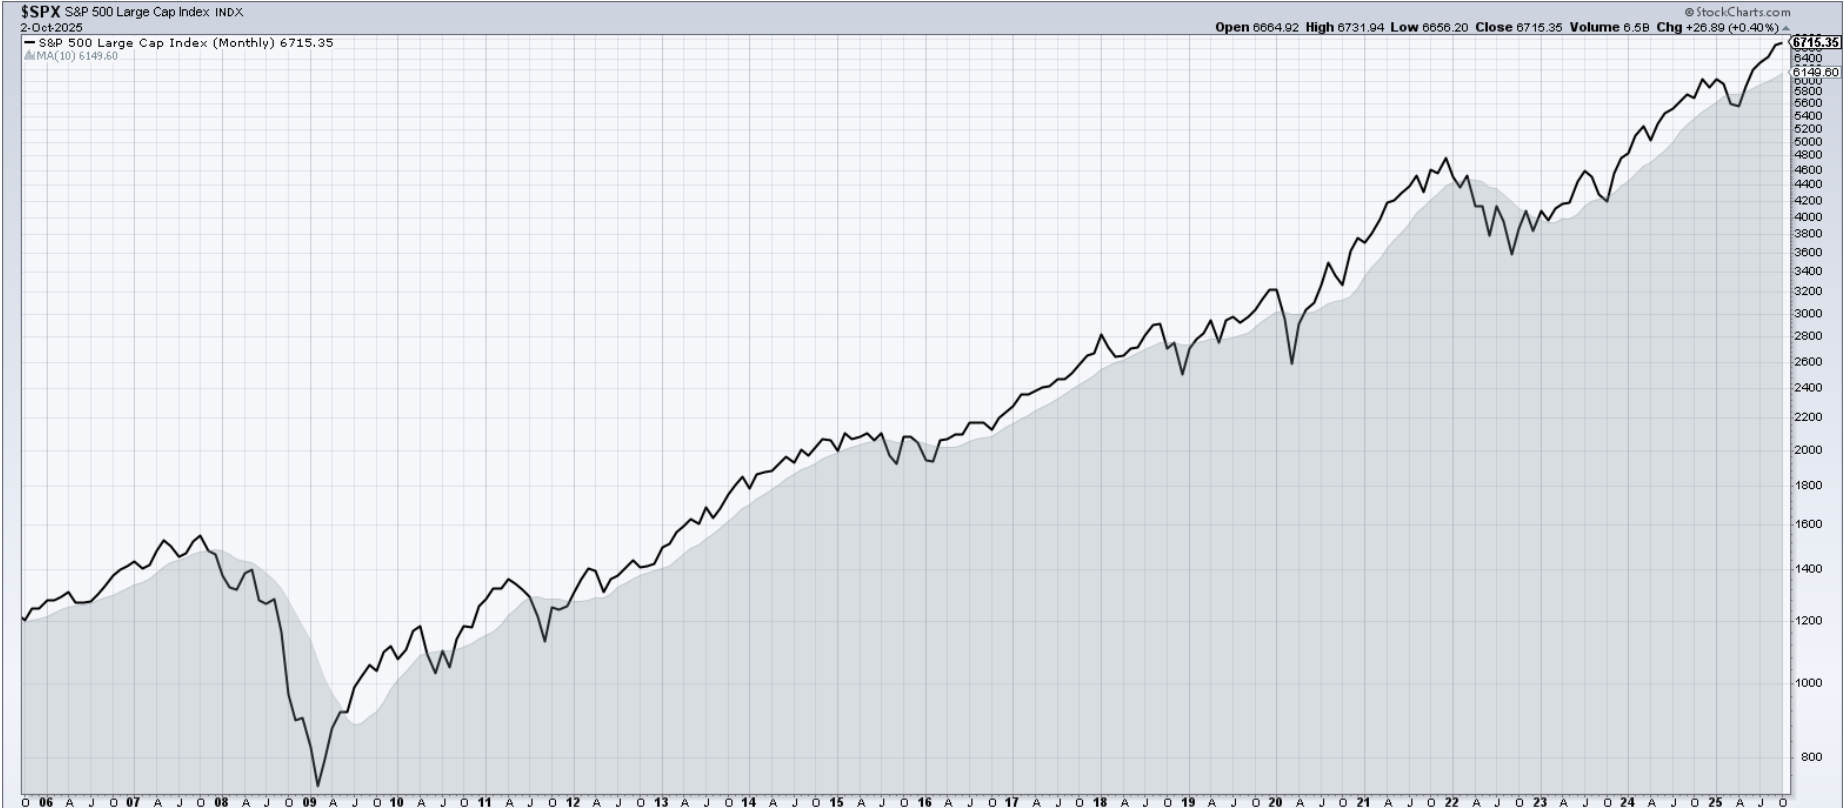
But I'd remind you of the intensity we felt just six months ago. Late March, early April – remember the tariff headlines, the breathless talking heads, the fear.
Do you see the steep drop below the 200-day moving average in 2020? The economy seemed like it could completely stop for a few weeks.
Think back to fall 2008. Big headlines, big declines – over and over.
I remember being at Disney World one week in October that year. I'd closed all my trading positions before vacation so could enjoy the vacation knowing I was completely flat. We hadn't watched any TV or seen the news in about a week – then I glanced up at a screen in the hotel lobby one afternoon. The Dow had dropped about 600 points that day – a huge number at the time.
My first reaction was relief that I was flat. My second reaction was to think about everybody else seeing those numbers and feeling their stomach drop. I knew that was not a good day for a lot of people.
Fast forward to today, and things look quite different, don't they?
Where We Stand Now
In early October, things look good. The S&P notched eight new all-time highs last month. That's a big monthly number for new highs. The index now sits 9% higher than the previous high back in February.
Does this feel anything like early 2000 or late 2007 before the market peaked? Notice whether it does or doesn't for you.
Looking at the five-year chart below, one thing jumps out – the index has gotten very stretched, that is, very far above the 200-day moving average. Think of that average like a rubber band. Prices stretch away from the moving average on either side regularly but then they get pulled back toward it.
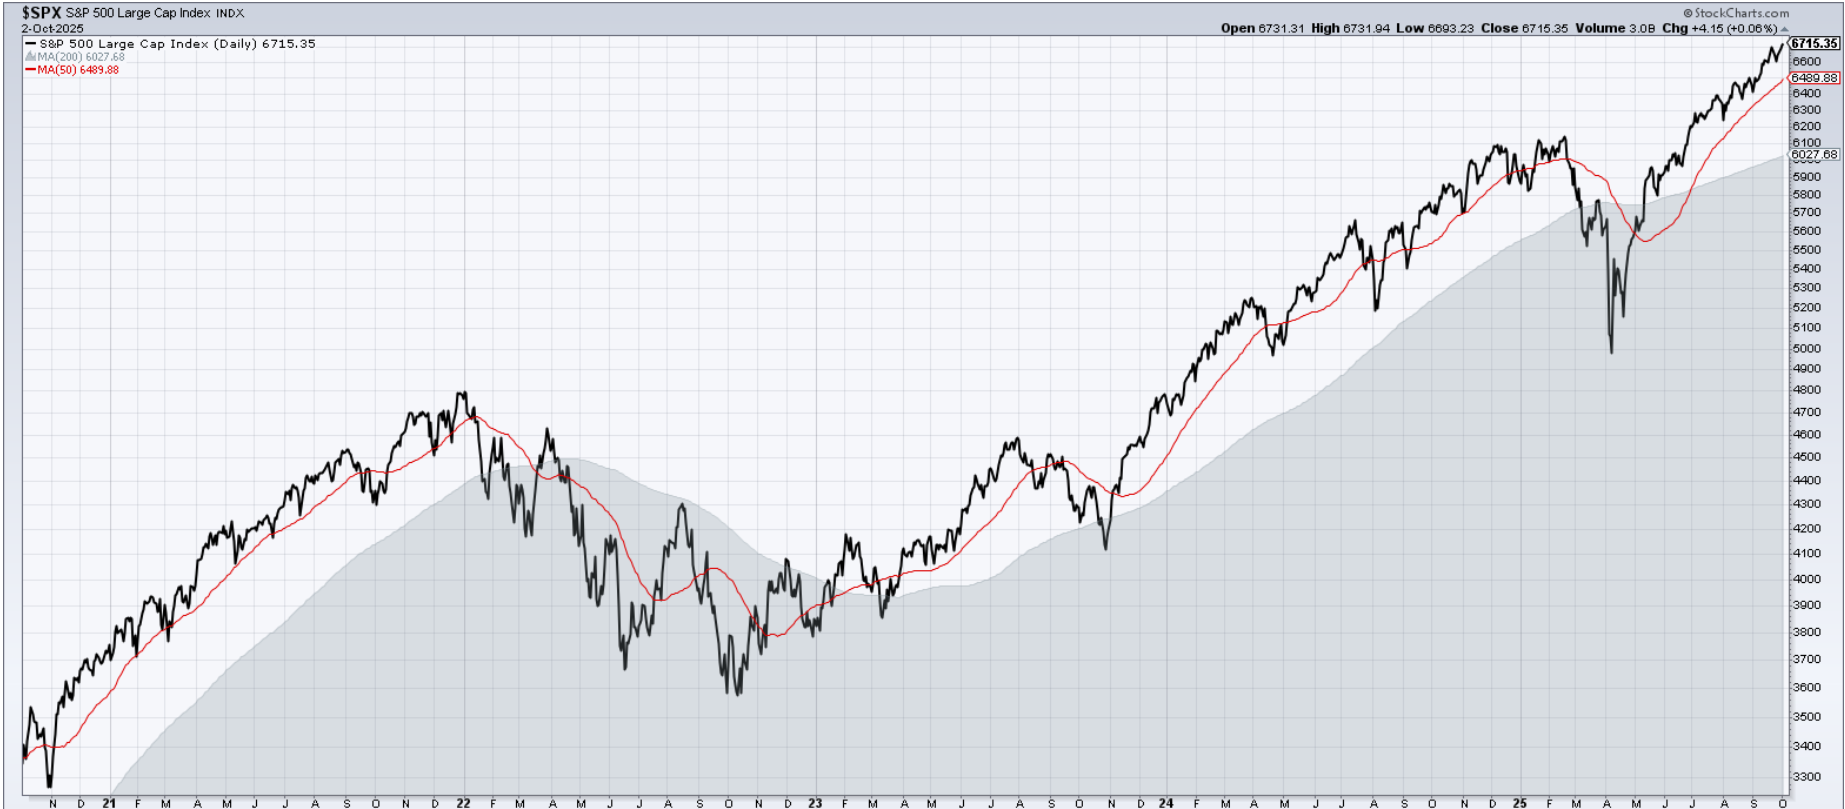
John Hussman pointed out in his September commentary that the S&P has been above its 50-day moving average for more than 100 days. Based on what's happened before in similar situations, he said we might see a quick 4% to 6% drop at some point. If that started tomorrow (not saying it will), the S&P would drop back to the 6150 to 6250 range, close to that 200-day moving average. The rubber band pulling it back.
But it could keep going up for days, weeks, or even longer.
Big Picture Insights – Valuations
Hussman's September commentary had a clear theme: today's record market highs will come at the cost of low future returns. He points to the Federal Reserve as the source.
Look at the Fed's balance sheet. In the early 2000s, it held assets worth around 6% of GDP. Then came TARP, QE1, QE2, QE3, and massive government deficit spending through the last couple years. By 2022, the Fed's balance sheet reached 32% of GDP. It's come back down to 22%, but the damage is done.
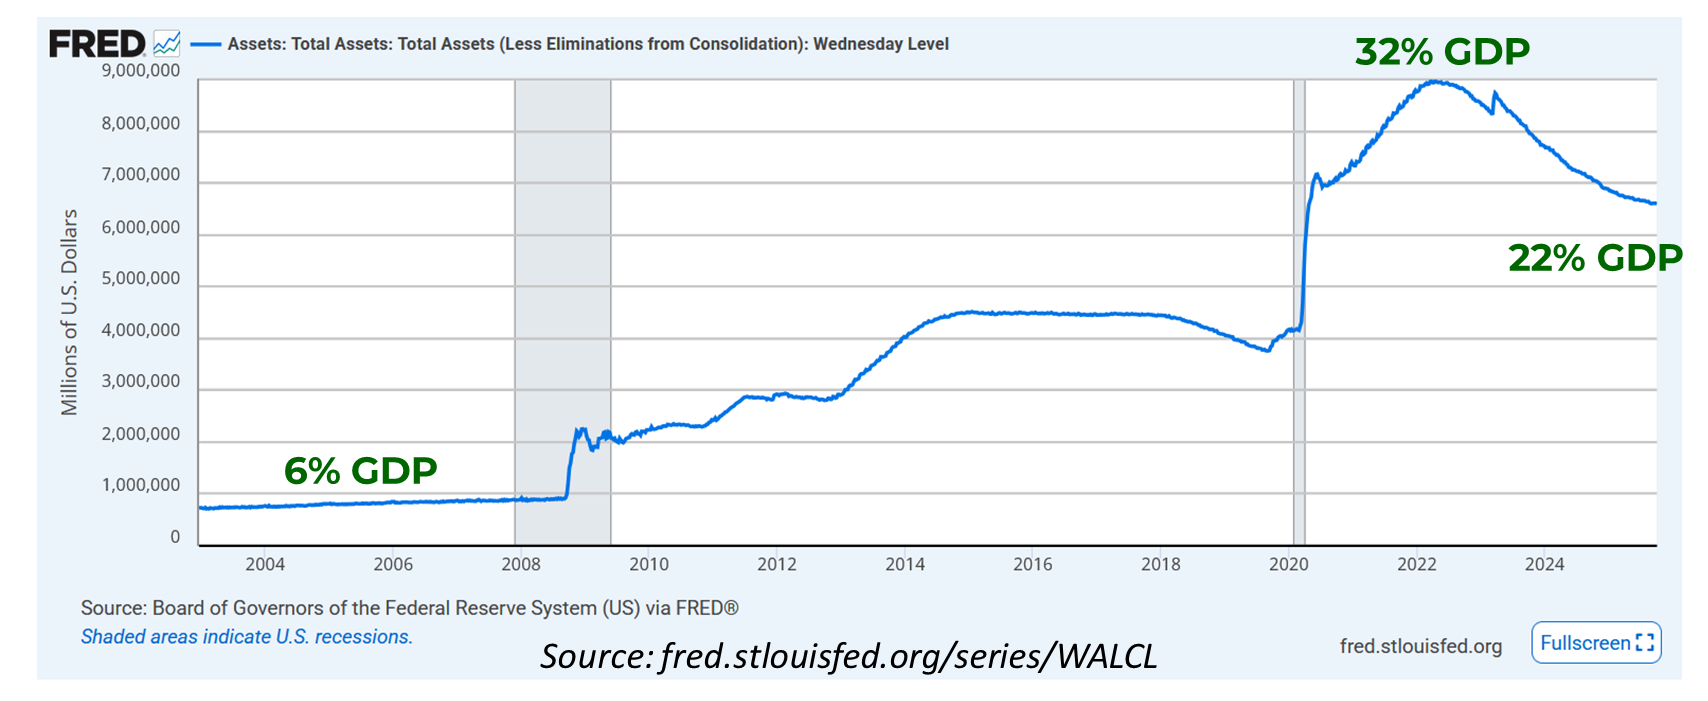
All that money pumped into the economy had to go somewhere. Some of it showed up as inflation. Another good portion showed up in the stock market. Cash earning very little interest wants to go somewhere so people and companies put it into stocks, which raises prices – a form of inflation.
Hussman has shown that the highest valuations in history imply the lowest expected future returns in history. By his preferred measure – gross value added – the current market sits at a greater extreme than 1929 or 2000. We are well into outlier territory.
What the PE Ratio Tells Us
Most of us understand the PE ratio better than gross value added. Think of the PE ratio like a price tag. When it hits record highs, you're paying the most ever for each dollar of company earnings. When it's low, you're picking up bargains.
The Shiller PE ratio (which averages the last 10 years) shows three major peaks over the last century: 1929, the late 1960s, and 2000. What happened after each peak? The line dropped off.
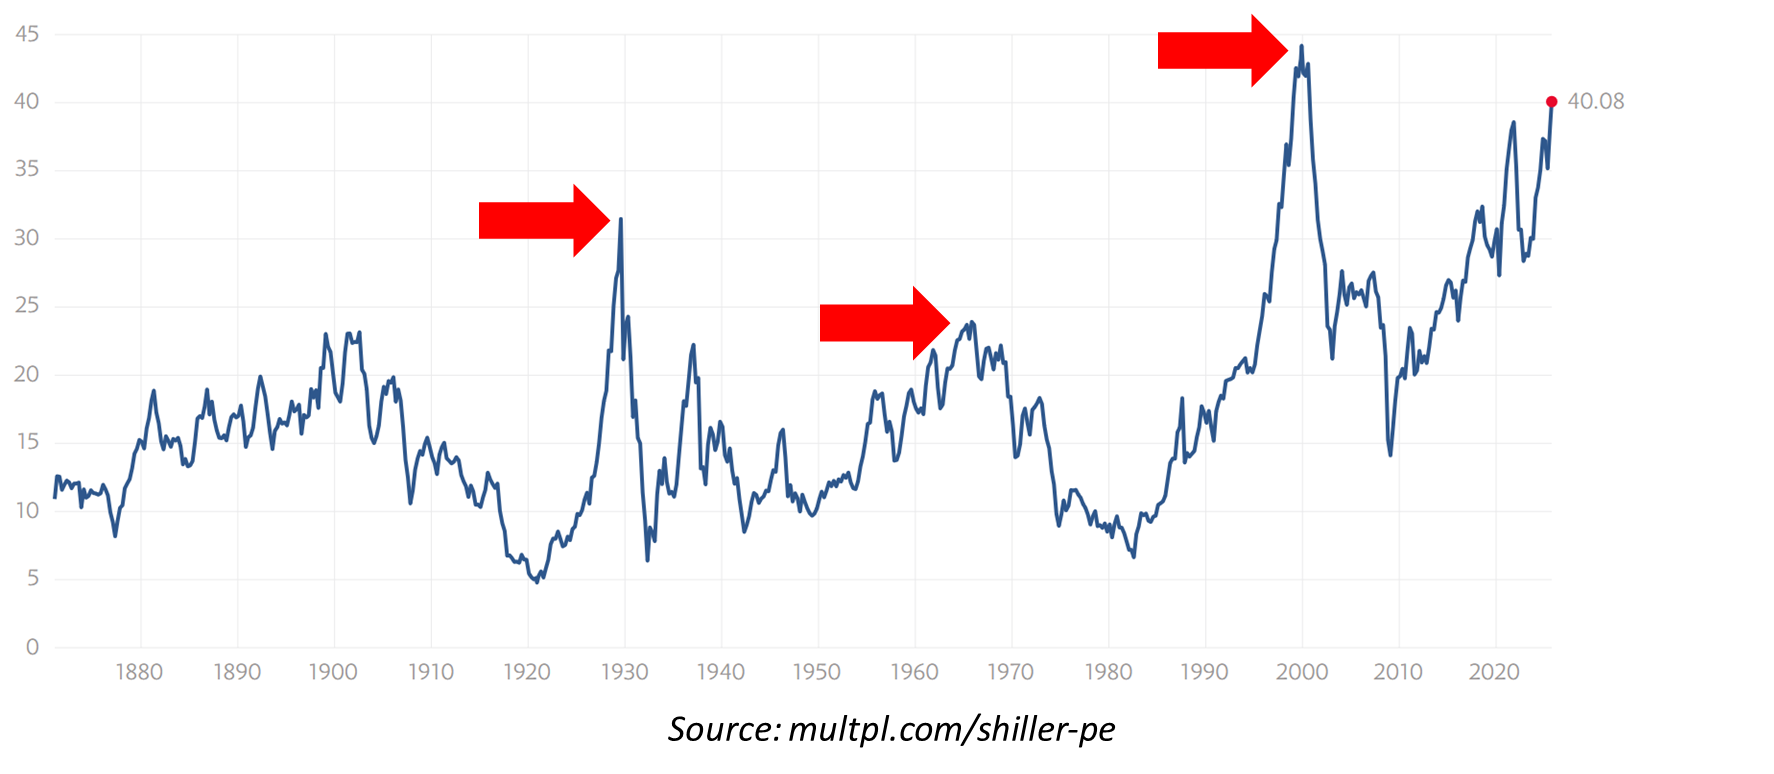
Ed Easterling at Crestmont Research shows those same three peaks. If we continue the PE line to today, it's back up around 40 – near record territory again.
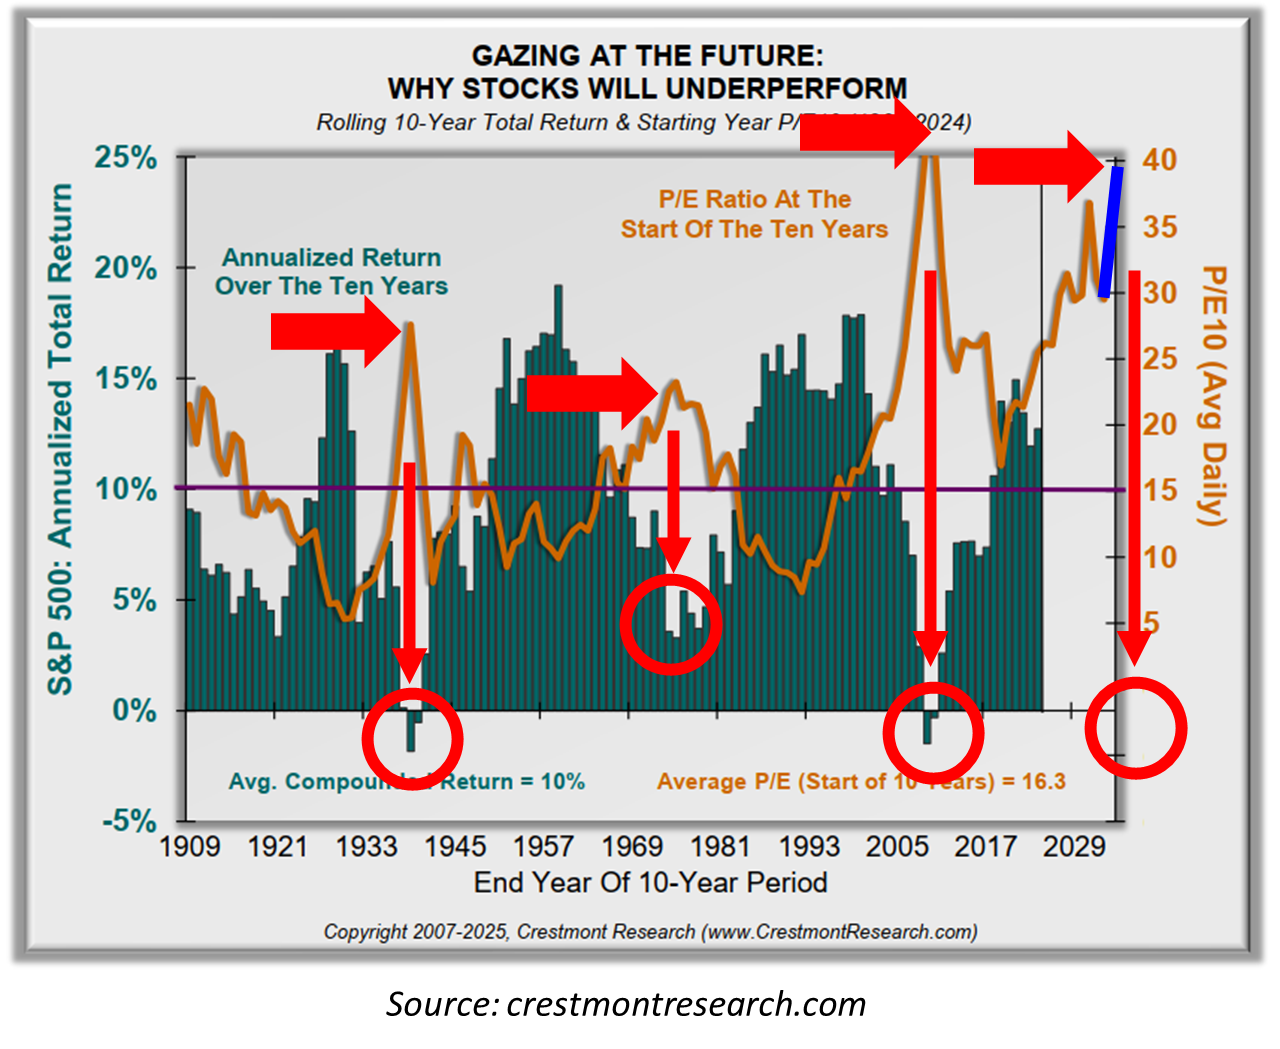
Easterling's research shows that when the PE ratio gets very high, returns for the next 10 years run much lower. In 1929, returns for the following decade went negative. In the late 1960s, stocks returned low single digits all through the 1970s. Anyone holding stocks from 2000 through 2010 had less money at the end than the beginning.
Eventually, prices recovered and climbed higher in each of those cases. This raises an important point for those of us near retirement. Our context, however – our constraint – is having a limited time horizon for being able to use investment money for retirement purposes.
Where does that leave us today?
We've already moved into historic record territory on multiple market measures. If the historical pattern occurs again, then we may well be looking at years of either very low single-digit returns, break-even, or possibly even losses in the stock market.
What This Means for Preparation
I don't know what will happen, and I'm not trying to predict where or when a top might occur. But look for yourself at stock market history for long-term run-ups. At some point, the cycle brings valuations (prices) back down. If that happens again, we shouldn't be surprised.
Near term, we may see a small correction like Hussman suggests. Intermediate term, maybe a bear market, perhaps even an historic one. When that happens, whenever it does, the recovery may require years, perhaps a decade based on what we've seen before.
Why talk about this? One word: preparation.
If you're like me, you might be thinking about retiring sometime in the next 10 years or so. Your feelings or gut will probably tell you things look fine . . . until suddenly they don’t. This is why I encourage a consistent, systematic approach to investing rather than a gut-based approach.
I'm interested in protecting my accounts and being able to access them at their current level rather than a lower number several years from now. I expect most people want something similar.
Next week, I'll cover three simple strategies to help us prepare for the scenarios we talked about today.
Until then, take care.
+++++++++++++++++
Important Disclosures
Past performance does not guarantee future results. Investing involves risk including the possible loss of principal.
The performance shown combines two different kinds of data. Results from January 2003 through December 2024 reflect backtested application of the SmartSignal methodology to historical price data. Results after January 2025 reflect actual signals delivered to subscribers during that period.
Backtested performance has inherent limitations. It does not represent actual trading. Backtested results benefit from hindsight and do not reflect the impact of trading costs, execution slippage, market liquidity, or the psychological pressures of investing real money during live conditions. For these reasons, backtested performance may differ materially from actual results. Individual subscriber results may also vary based on execution timing, account composition, and other factors.
TenHundred Co., its officers, employees, and partners may hold positions in the ETFs or securities referenced by the SmartSignal methodology, and may trade those positions without notice. TenHundred Co. reserves the right to modify or discontinue the methodology at any time, and past performance data may not reflect the current methodology.
Growth Guardian Investor publishes systematic investing education and methodology training under the publisher's exclusion to the Investment Advisers Act of 1940. We do not provide personalized investment advice. Subscribers make their own investment decisions.
Full Disclaimers Statement on www.gginvestor.com.