Three Numbers Professional Investors Watch - That You Probably Don't
Do you remember February, 2009? After a brutal 2008 decline, the market continued declining. How low could it go? Now, picture a fund manager facing his board that month presenting on the fund’s 2008 performance and explaining why he deserved to keep his job. His fund had dropped 14% while the S&P 500 cratered 44% the prior year. The conversation didn't focus on excuses or predictions. Instead, he walked them through three metrics his team had tracked all along - numbers that proved their system worked exactly as designed, even during the worst financial crisis in 80 years.
What investment numbers do you track? Most investors I have spoken with don't track what professionals track. That means they can't really tell if their approach actually works - not until a real bear market tests it. The risk for them right now? The test might arrive precisely when you're least positioned to recover from it. Here's what makes this particularly challenging: market shifts often develop slowly, almost unnoticeably at first, lulling you into comfort. Then volatility kicks into high gear suddenly. By the time the decline feels urgent enough to act, you've already absorbed the kind of drawdown that changes your retirement math.
Go back to the late 1990s. Investors who held "moderate risk" portfolios discovered what a 7-year drawdown felt like when the tech bubble burst. The S&P 500 dropped nearly 50%, taking until 2007 to recover. Most investors didn't panic - they followed conventional wisdom and stayed put. The root problem actually started far earlier. They'd never related their "moderate risk" label to actual drawdown numbers. They had no measure for what survivable actually meant for their timeline - not before the decline started, and then, not once it got rolling. Most folks were relieved to get back to break-even in 2007 never having learned what or how to measure what went wrong.
What did the professionals know that those investors didn't? The professionals knew something different - and they knew it long before the global financial crisis or the internet bubble. They track three specific metrics that reveal whether a strategy actually fits an investor's timeline: 1. maximum drawdown percentage, 2. time to breakeven, and 3. how these two numbers roll up into the actual long-term measure. The math behind them? Turns out simpler than most people expect. Let me walk you through each one.
The Three Numbers Professionals Track
The first metric: maximum drawdown percentage. Take the highest account value, find the lowest point after that peak, calculate the percentage drop. That number tells you how much pain your approach delivers when conditions turn.
Here's what catches people off guard: a $500,000 account dropping 25% needs a 33% gain just to break even. Why doesn't a 25% gain bring you back? Because you're recovering from a smaller base. After that 25% decline, you're starting at $375,000, not $500,000. To climb back to half a million, you need to make $125,000 - which now equals 33% of your reduced balance.
The deeper the drawdown, the steeper the climb back -
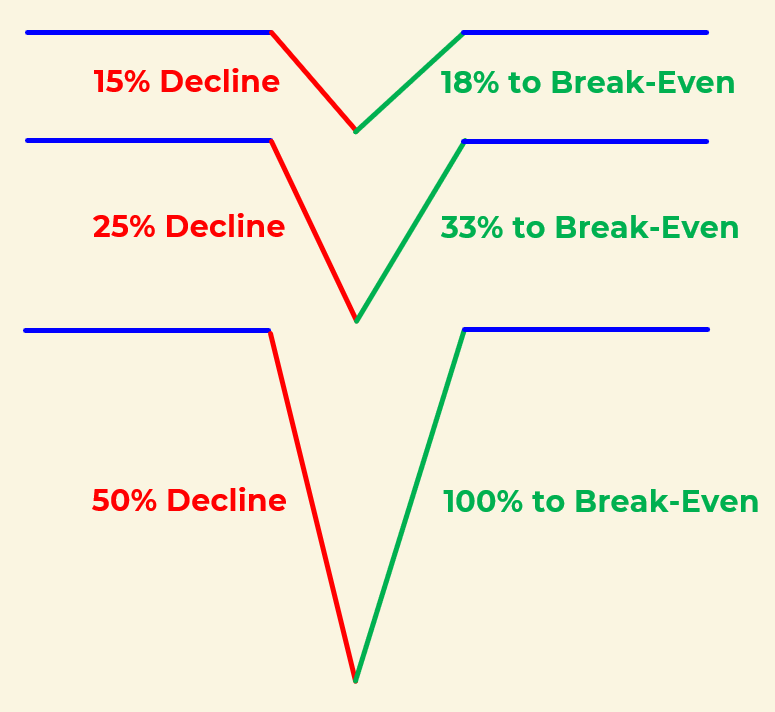
The second number tracks how much time passes between your peak and when you recover back to that peak - your time to breakeven. Consider two scenarios: a 35% drawdown recovering in 18 months versus a 20% drawdown taking 60 months - or 5 years. Most investors focus on the percentage drop and miss what matters just as much – time in drawdown. Most people can stomach an 18 month recovery - it feels like a rough patch you survived. Five years though? When you're 58, a 5 year recovery means you're 63 before you're back just to where you were at 58. You've watched half a decade disappear. That's not volatility. That's time you won’t recapture, compounding you'll never recover, and retirement plans you may need to delay and revise.
The third metric ties the first two together: compound annual growth rate, or CAGR. This reveals your true long-term returns – rather than the commonly referenced average of returns.
Want a simple example of the difference? Bill, my co-author just shared with me the following demonstration -
· You invest $100K.
· The investment goes up 100% in the first year and drops 50% in the second year.
· Average return math = (100% - 50%) / 2 = 25%.
· Apply the average with quick math in your head ($100K, 25%, 2 yrs) - somewhere around $150K?
· Nope. Your actual ending equity is $100K.
· Better measure - CAGR = 0% return.
That’s why CAGR matters. Average returns can look impressive but they also hide the cost of volatility. For a more realistic example – take two portfolios that both average 10.6% annually. One, however, has bigger drawdowns followed by strong recoveries and it delivers far less wealth than one with steady years in the 8-12% range.
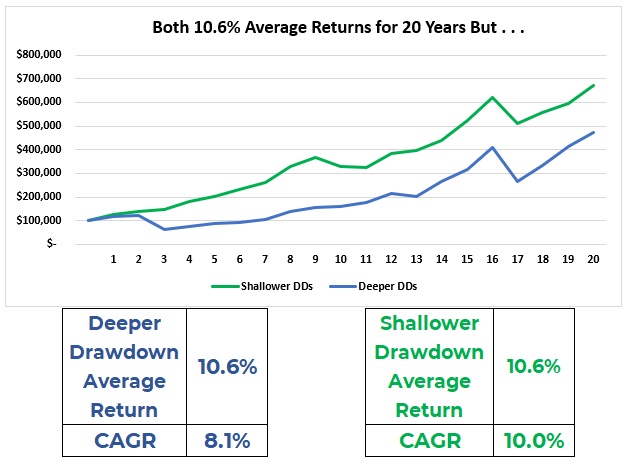
The professionals figured this out decades ago: approaches with smaller drawdowns often produce better long-term results than strategies courting volatile drops and gains. Limiting catastrophic losses matters more than capturing every upside move. CAGR shows you the actual growth rate of your wealth over time, accounting for the compounding damage that deep drawdowns inflict. Be sure to ask for the CAGR if someone talks only about the average return.
What The Numbers Look Like In Practice
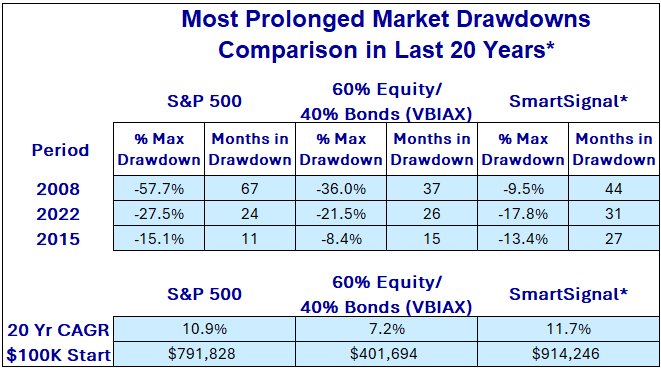
Now let's see what these numbers mean in the real world. The SmartSignal System's 20-year backtest shows an 11.7%* CAGR with a worst maximum drawdown of 18%* in the last 20 years. If that sounds a little scary, compare that to the S&P 500 max drawdown: a 57% decline. The global financial crisis decline required 67 months (5 and a half years) to recover to the 2007 peak. Now, both approaches can deliver solid long-term returns, but as you get closer to your retirement date, drawdown size and length grow exponentially more important - due to your lack of recovery time. A smaller degree drawdown or a shorter recovery might delay your retirement date for a short while. But a decline of more than 50% taking more than 5 years to recover? That potentially derails retirement for years forcing you to work longer than planned while your account slowly climbs back.
See the following table for a comparison of these three metrics for the S&P, a “traditional” 60/40 portfolio, and the SmartSignal Investment System -
These three metrics form parts of the system performance measurements we write about in Smart Is Not Enough (working title). The upcoming book walks readers through how to quantify whether an investment approach actually matches your objectives and beliefs - not just whether it "sounds good" or comes recommended by an expert. Following a systematic investment approach with strong risk management processes explains how some investors sleep just fine during market volatility while others panic. The difference isn't intelligence or experience. It's whether they measured their system's numbers before live market conditions actually started testing them. When the markets start declining, they already know what "working as designed" should look like.
Your Turn
Remember that fund manager from early 2009, the one who kept his job because he knew his numbers? You're about to become him. Pull the account statements from the past few years and calculate your own metrics. Your CAGR might surprise you (hopefully in a good way). You may also discover you don't know what your maximum drawdown or recovery time has been recently - which means you're heading into whatever comes next without sufficient preparation.
Whether you choose SmartSignal or some other systematic approach, knowing these three numbers before the next major decline will beat discovering them the hard way - during the “event”. When you measure first, you become both architect of your growth and guardian of your timeline. The next market cycle doesn't have to catch you unprepared.
+++++++++++++++++
Important Disclosures
Past performance does not guarantee future results. Investing involves risk including the possible loss of principal.
The performance shown combines two different kinds of data. Results from January 2003 through December 2024 reflect backtested application of the SmartSignal methodology to historical price data. Results after January 2025 reflect actual signals delivered to subscribers during that period.
Backtested performance has inherent limitations. It does not represent actual trading. Backtested results benefit from hindsight and do not reflect the impact of trading costs, execution slippage, market liquidity, or the psychological pressures of investing real money during live conditions. For these reasons, backtested performance may differ materially from actual results. Individual subscriber results may also vary based on execution timing, account composition, and other factors.
TenHundred Co., its officers, employees, and partners may hold positions in the ETFs or securities referenced by the SmartSignal methodology, and may trade those positions without notice. TenHundred Co. reserves the right to modify or discontinue the methodology at any time, and past performance data may not reflect the current methodology.
Growth Guardian Investor publishes systematic investing education and methodology training under the publisher's exclusion to the Investment Advisers Act of 1940. We do not provide personalized investment advice. Subscribers make their own investment decisions.
Full Disclaimers Statement on www.gginvestor.com.