The Wrong Kind of Risk
If you've ever worked with a financial advisor, you may have filled out a questionnaire with a question about your risk tolerance. The choices were probably: high, medium, or low. Professional fund managers - people who actually buy and sell investments for a living, define risk completely differently. That difference largely explains who panics in big drops and who sleeps just fine - even during extended bear markets. Here's what fund managers know that advisors’ questionnaires don't ask.
The Risk Tolerance Problem
Those questionnaires oversimplify "risk tolerance" into low/medium/high, but the question mislabels risk because it actually combines three distinct concepts.
· First, emotional tolerance - how you predict you will react when your account drops 10-20%.
· Second, financial capacity - how much loss you can absorb without derailing your plans.
· Third, volatility comfort - whether large price swings feel acceptable or cause you stress.
Lumping these three together measures your psychological response to volatility, not your actual ability to take risk. One reason advisors often misclassify people? The low/medium/high label confuses how someone feels about losses with how much loss that person could practically afford.
Financial Advisors’ Definition
Typically, advisors measure risk using standard deviation - how much your account bounces around month to month. A portfolio that commonly swings up 5% and down 3% might get labeled "high risk." This thinking led to the classic 60/40 portfolio: add a 40% bond allocation to 60% stocks in order to smooth out the volatility.
On paper, the math works elegantly. Lower standard deviation equals lower risk equals better sleep.
Except standard deviation is not what risk actually means.
What Risk Actually Means
Professional fund managers actually risk their investors’ money every day. For them, risk isn't how much your account bounces around - it's how much they can lose and how long it takes to recover that loss.
A 50% decline isn't "high volatility." It's a crisis that requires a 100% gain just to break even. When you're within 10 years of retirement, you may not have time to recover from that kind of loss. Time horizon matters – a lot! At age 30, a decade - long recovery may not be pleasant but it’s entirely tolerable. At age 58? You're running out of time.
The Math That Changes Everything
Let’s look at two hypothetical portfolios over the same 20 year period. Both averaged 10.6% annually. The Systematic portfolio’s best and worst year were +27% and -18%. The Buy+Hold portfolio’s best and worst year were +32% and -50%. Both portfolios had 3 years of losses and 17 years of positive returns. Systematic maintained steadier growth with occasional smaller dips while Buy+Hold experienced bigger swings - but in the end, both averaged 10.6%.
The Systematic portfolio turned $100,000 into $672K while the Buy+Hold portfolio turned $100,000 into $474K. That's a $198K difference. What made the difference? Not lower volatility, but limiting that catastrophic -50% loss.
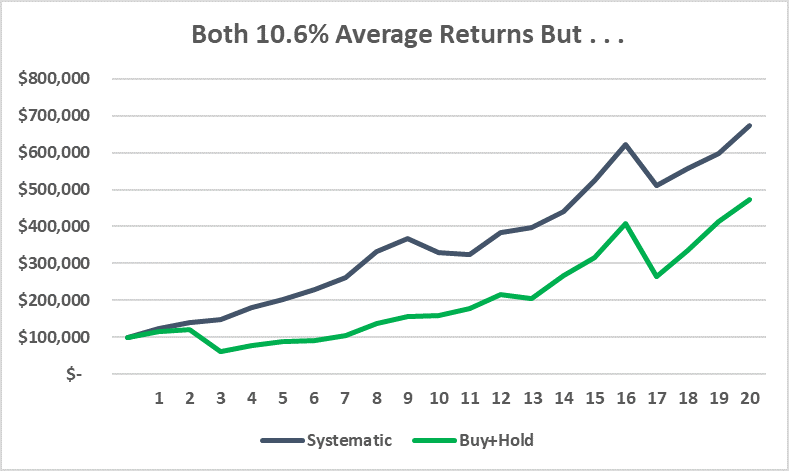
Radically different outcomes. Same average return.
The reason? Limiting maximum loss to -18% instead of -50% preserved compounding power. When you drop 50%, you need a 100% gain to recover. You don't just lose the money in the drop - you lose all of the compounding on that money for however long the recovery takes. The 2000-2002 market decline took until 2007 to breakeven only to then fall again during the global financial crisis. Full recovery? Not until 2013. That's 13 years of lost compounding.
Volatility might feel uncomfortable. Drawdowns, however, destroy wealth.
Maximum Drawdown Explained
Maximum drawdown represents the largest peak-to-trough decline your portfolio experiences. Think of it as the worst-case scenario - what happens if you bought at the absolute top and held through the absolute bottom.
During 2007-2009, a $500,000 account in the S&P 500 dropped 57%. You would have watched it fall to $215,000. Target-date funds designed for retirement in the 2025-2040 year range? They dropped too, less than stocks but still in the neighborhood of -40% to -50%.
Two Approaches to Risk
Financial advisors call these "volatility events." For investors, however, a more accurate name would be "wealth-destroying events." They require years to recover from - years that someone close to retirement simply doesn’t have.
Professional fund managers face the same constraint: their investors won't wait through years-long recoveries. They'll just pull their money. So fund managers focus on limiting maximum drawdown - not smoothing volatility.
The difference matters more than most investors realize.
Smoothing volatility keeps you invested through the entire decline.
It just makes the ride slightly less bumpy. That 60/40 portfolio? Those still dropped somewhere around -40% in 2008. Bonds cushioned the fall but didn't prevent wealth destruction. Maybe you didn’t feel quite as bad watching it happen, but your $500,000 still became about $300,000.
Limiting maximum drawdown means exiting when conditions deteriorate.
You accept missing some upside to avoid catastrophic losses. You might look “behind” or even "wrong" during years when market grinds higher despite weak signals. But when the bear market comes, you preserve the capital that compounds over decades.
That's the difference between a -18% decline and a -57% decline. One you recover from in months. The other takes years - years many near-retirees don't have.
How Systematic Risk Management Works
The SmartSignal System's maximum drawdown over 20 years of backtesting was -18% because it uses monthly systematic exits to limit the depth of losses. During the 2008 crisis, SmartSignal generated positive returns while the S&P dropped -57%. More recently, in March 2025 SmartSignal declined -9% while the S&P dropped -21%.
Past performance doesn't guarantee future results. We can’t make predictions. But the system’s rules demonstrate an important principle: professional risk management prioritizes limiting catastrophic loss over managing emotional comfort with volatility.
The system exits positions when trends break, momentum stalls, they show losses, or some combination of those factors. This approach accepts small losses to avoid devastating ones like in 2008, 2020, or 2025. Not because it had any predictive capabilities for the global financial crisis or the pandemic crash or the tariffs drop this spring. It does not predict. But rules-based exits based on the system’s three factor inputs (trend, momentum, and relative strength) limit how deep losses get regardless of the cause.
What Risk Really Means For Your Portfolio
Within 10-20 years of retirement, your real risk in the financial “red-zone” comes down to running out the clock. A 50% decline at age 58 impacts you fundamentally differently than the same decline would have at age 30. The 30 year old has decades to recover. After such a loss, the 58 year old might be forced to delay retirement by five years or more.
Our forthcoming book covers how to think systematically and create systematic approaches to minimize your account's maximum drawdown. I’ll have more on the book in the coming weeks.
Your Risk Questions
Next time someone asks you about your risk tolerance, ask about maximum drawdown instead. Ask what the worst peak to trough decline would be in the portfolio they're pitching. Ask how long recovery took after 2008. Ask what would happen if a GFC type decline occurs when you're in your early 60s.
The answers will reveal whether they're trying to measure your emotional comfort with volatility or if they understand actual risk vs just volatility. That difference may determine whether you retire on schedule or if you’ll need to work some extra years before retiring.
These questionnaires ask how you feel about risk. The right questions focus on what risk will truly cost.
+++++++++++++++++
Important Disclosures
Past performance does not guarantee future results. Investing involves risk including the possible loss of principal.
The performance shown combines two different kinds of data. Results from January 2003 through December 2024 reflect backtested application of the SmartSignal methodology to historical price data. Results after January 2025 reflect actual signals delivered to subscribers during that period.
Backtested performance has inherent limitations. It does not represent actual trading. Backtested results benefit from hindsight and do not reflect the impact of trading costs, execution slippage, market liquidity, or the psychological pressures of investing real money during live conditions. For these reasons, backtested performance may differ materially from actual results. Individual subscriber results may also vary based on execution timing, account composition, and other factors.
TenHundred Co., its officers, employees, and partners may hold positions in the ETFs or securities referenced by the SmartSignal methodology, and may trade those positions without notice. TenHundred Co. reserves the right to modify or discontinue the methodology at any time, and past performance data may not reflect the current methodology.
Growth Guardian Investor publishes systematic investing education and methodology training under the publisher's exclusion to the Investment Advisers Act of 1940. We do not provide personalized investment advice. Subscribers make their own investment decisions.
Full Disclaimers Statement on www.gginvestor.com.